PBMCpedia Tutorial
Overview
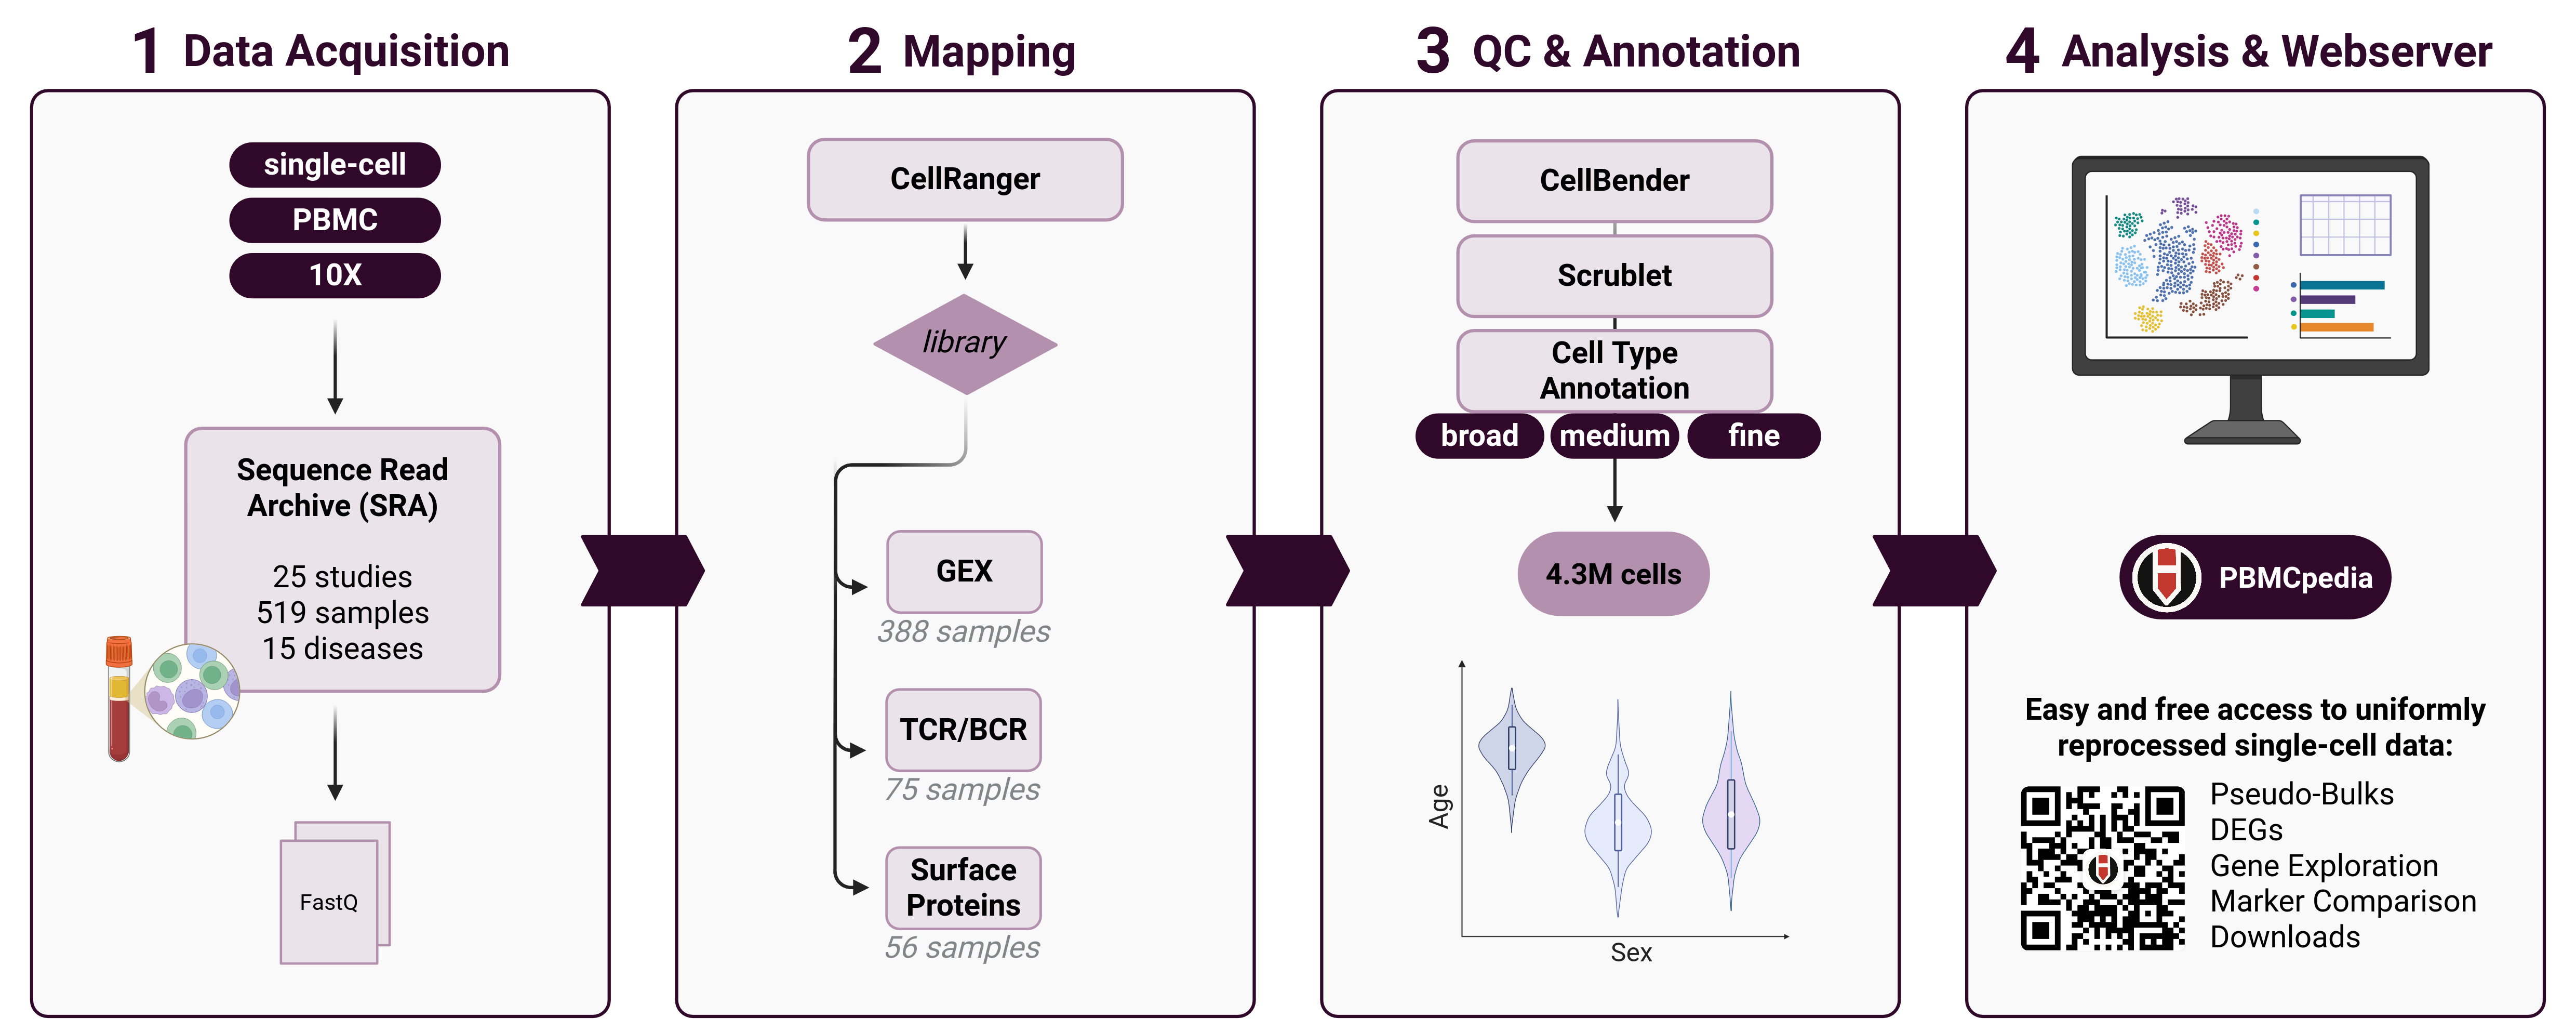
PBMCpedia is a comprehensive, large-scale single-cell reference atlas of human peripheral blood mononuclear cells (PBMCs), created to facilitate deep exploration of immune cell diversity across age, sex, and disease states. This resource integrates 4.3M high-quality PBMC profiles from 25 publicly available single-cell RNA-sequencing (scRNA-seq) studies, harmonized and annotated using standardized and reproducible pipelines.
🎯 Main Functions
PBMCpedia provides several key analytical tools:
- 📊 Dataset Overview - Explore sample metadata and study information
- 🧬 DEGs & Pathways - Identify differentially expressed genes and enriched pathways
- 🔬 Cell Type Overview - Visualize cell type proportions and gene expression patterns
- 🎯 Marker Comparison - Compare dataset-derived markers with reference databases
- 🔍 Gene Exploration - Explore gene expression across cell types and conditions
- 🧬 TCR/BCR Analysis - Analyze T-cell and B-cell receptor repertoires
- 🔬 Surface Proteins - Explore protein expression patterns across diseases
📋 Data Processing Pipeline
We collected raw gene expression data and metadata from 25 studies available in the Sequence Read Archive (SRA), which were mapped against the human reference genome using CellRanger. Each sample was quality-controlled to remove poor-quality cells and low-complexity samples using CellBender. Scrublet was applied for doublet detection.
All data were processed through a uniform scRNA-seq pipeline using Scanpy and AnnData objects, consisting of:
- Filtering cells by mitochondrial content and gene count
- Normalization and log-transformation
- Highly variable gene selection
- Scaling and PCA
- Batch correction using Harmony
- Clustering and UMAP for visualization
- Cell type annotation using both manual expert curation and automated classification with CellTypist (AIFI_L1 to L3)
📸 Graphical Abstract
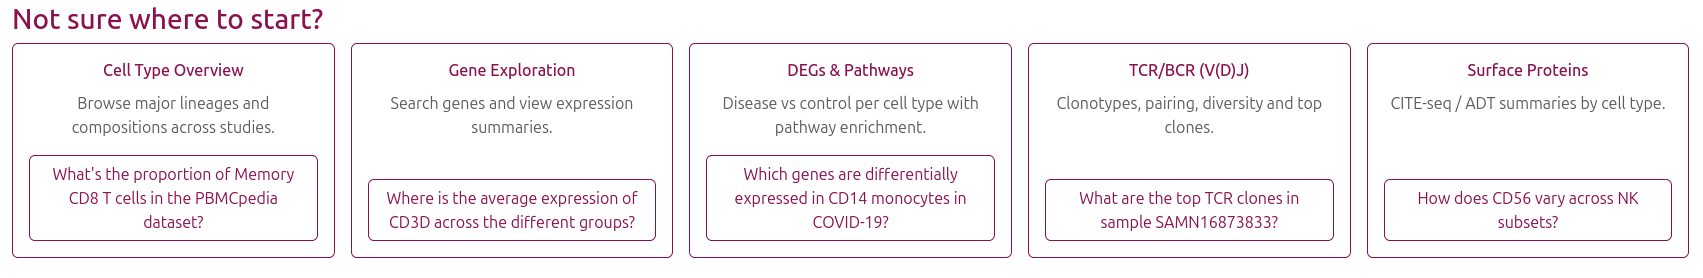
🏠 Homepage Example Cases
The homepage provides quick access to common analysis scenarios through example links:
Getting Started
Start by exploring the Dataset Overview to understand the available data, then use the example links on the homepage to quickly access specific analyses. Each section includes detailed instructions and interactive visualizations.
Dataset Overview & Metadata
The Dataset Overview page provides a comprehensive summary of all samples and studies included in PBMCpedia. This is your starting point for understanding the available data and planning your analyses.
📊 Disease Distribution Bar Chart
The first plot displays all diseases found in the metadata on the x-axis, with bars representing the number of associated samples per disease. It's an interactive bar chart: when you hover over a bar, a tooltip appears showing detailed summary information for the corresponding study, including:
- BioProject accession - Links to NCBI BioProject database
- Disease - The specific condition or healthy control
- Total sample count - Number of samples in the study
- Sex breakdown - Distribution of male/female/unknown donors
- Details - Short description of the study
- DOI - Link to the original publication

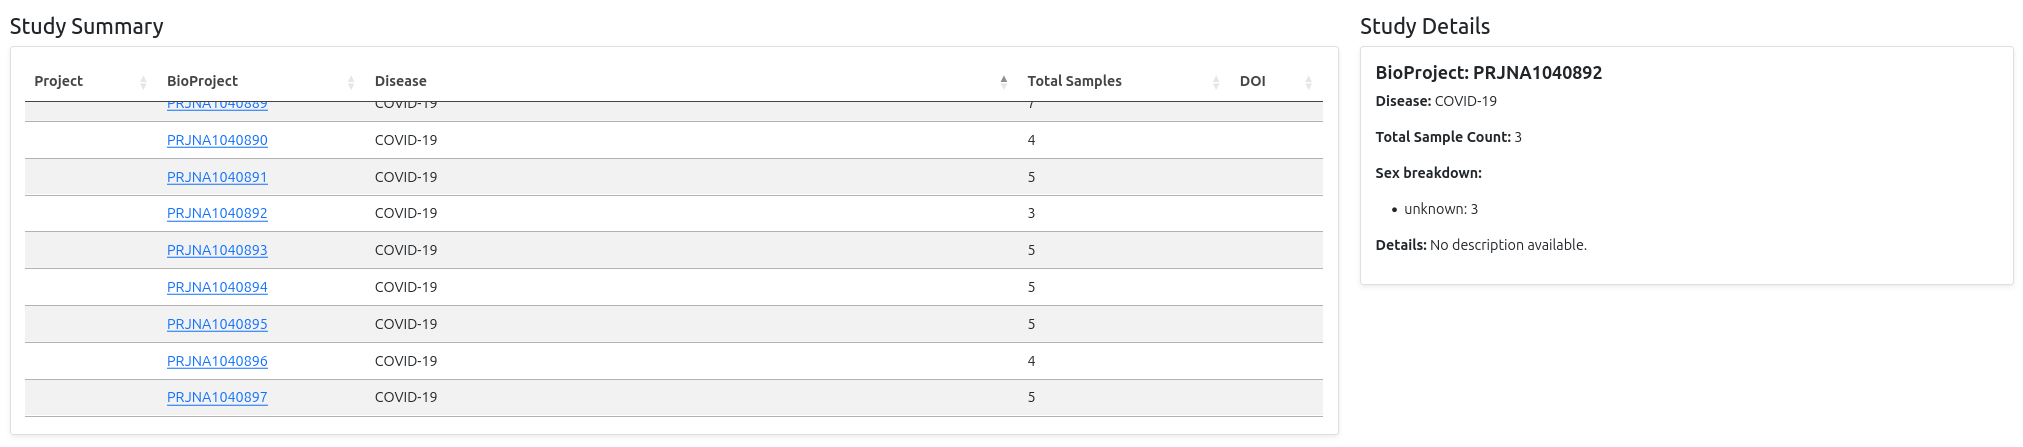
📋 Sample Metadata Table
Below the bar chart, you'll find a comprehensive metadata table with the following columns:
- Project - Project identifiers (e.g., P10, P13)
- BioSample -
SAMNaccession numbers (unique biosample identifiers) - BioProject -
PRJNAaccessions (NCBI BioProject study IDs) - Age - Age display information
- Sex - Male, Female, or Unknown
- Disease - Donor condition (e.g., COVID-19, Healthy, Alzheimer's disease)
🔍 Interactive Features
- Search - Filter by typing keywords (e.g.,
COVID,female) - Sort - Click column headers to sort by any field
- Pagination - Navigate through large datasets
- Export - Download filtered results as CSV
Pro Tip
Use the metadata table to identify specific samples or studies for your analysis. The search function is particularly useful for finding samples from specific diseases or demographic groups.
DEGs & Pathways Analysis
The DEGs and Pathways page allows you to identify differentially expressed genes and enriched biological pathways across different subsets of the PBMC dataset. This is one of the most powerful analytical tools in PBMCpedia for understanding disease mechanisms and immune responses.
🎛️ Filter Selection
To begin your analysis, define your subset of interest by selecting the following filters:
- Cell Type & Resolution: Choose between broad (major cell types) or fine (detailed subtypes) resolution
- Disease: Focus on specific conditions (e.g., COVID-19, Alzheimer's disease) or compare healthy vs diseased states
- Sex: Filter by male, female, or all sex donors
- Age Group: Select age brackets - Young (0–24 yrs), Adult (25–64 yrs), Elderly (>65 yrs), or All
- Study: Focus on specific studies or analyze across all studies
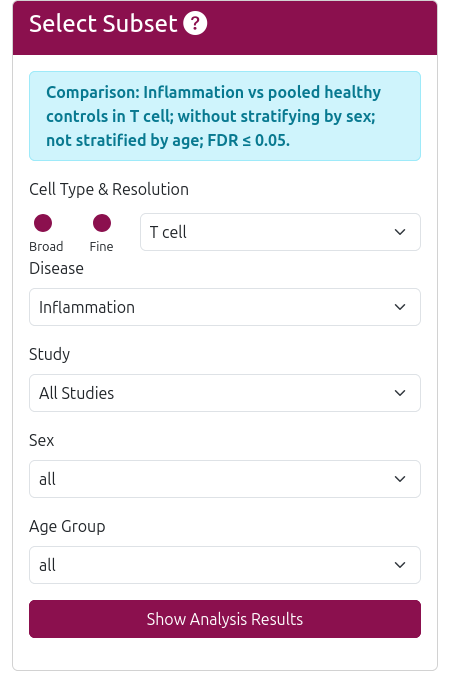
After setting your filters, click Run Analysis to compute DEGs and associated pathways. The analysis typically takes a few seconds to complete.
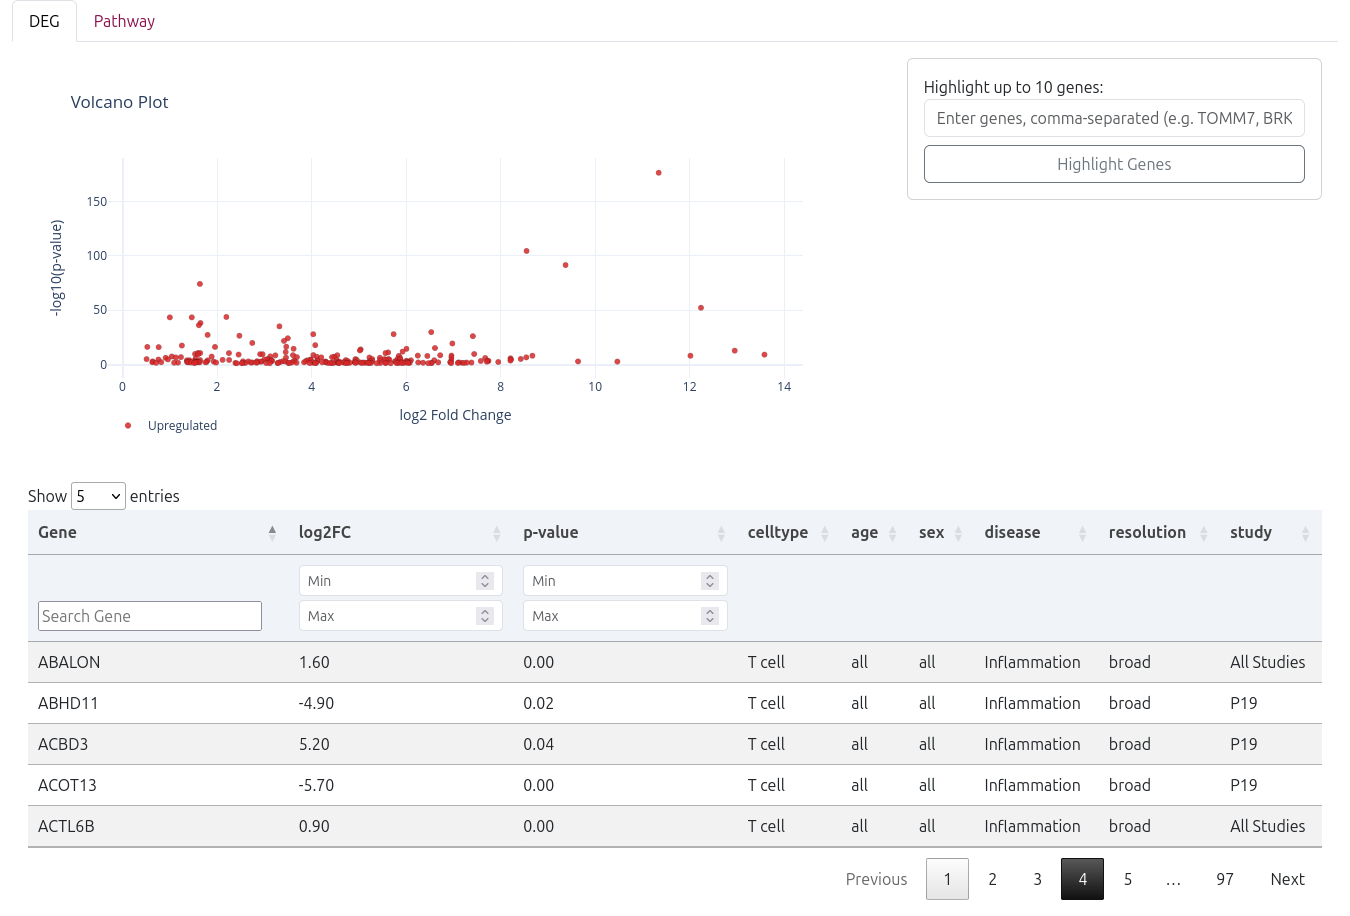
🧬 Differentially Expressed Genes (DEGs)
The analysis results begin with an interactive volcano plot that visualizes the significance and magnitude of gene expression changes:
- X-axis: Log2 fold change (magnitude of expression difference)
- Y-axis: -log10(p-value) (statistical significance)
- Color coding: Red points indicate significantly upregulated genes, blue points show downregulated genes
- Interactive features: Hover over points to see gene names and statistics
You can manually highlight up to 10 specific genes by entering their names as a comma-separated list in the "Highlight Genes" field.

📊 DEG Results Table
Below the volcano plot, a detailed DEG table provides comprehensive information for each differentially expressed gene:
- Gene - Gene symbol and name
- log2FC - Log2 fold change (positive = upregulated, negative = downregulated)
- p-value - Statistical significance (raw p-value)
- Cell Type - The cell type where the gene is differentially expressed
- Age - Age group analyzed
- Sex - Sex group analyzed
- Disease - Disease condition compared
- Resolution - Cell type annotation resolution used
- Study - Study identifier
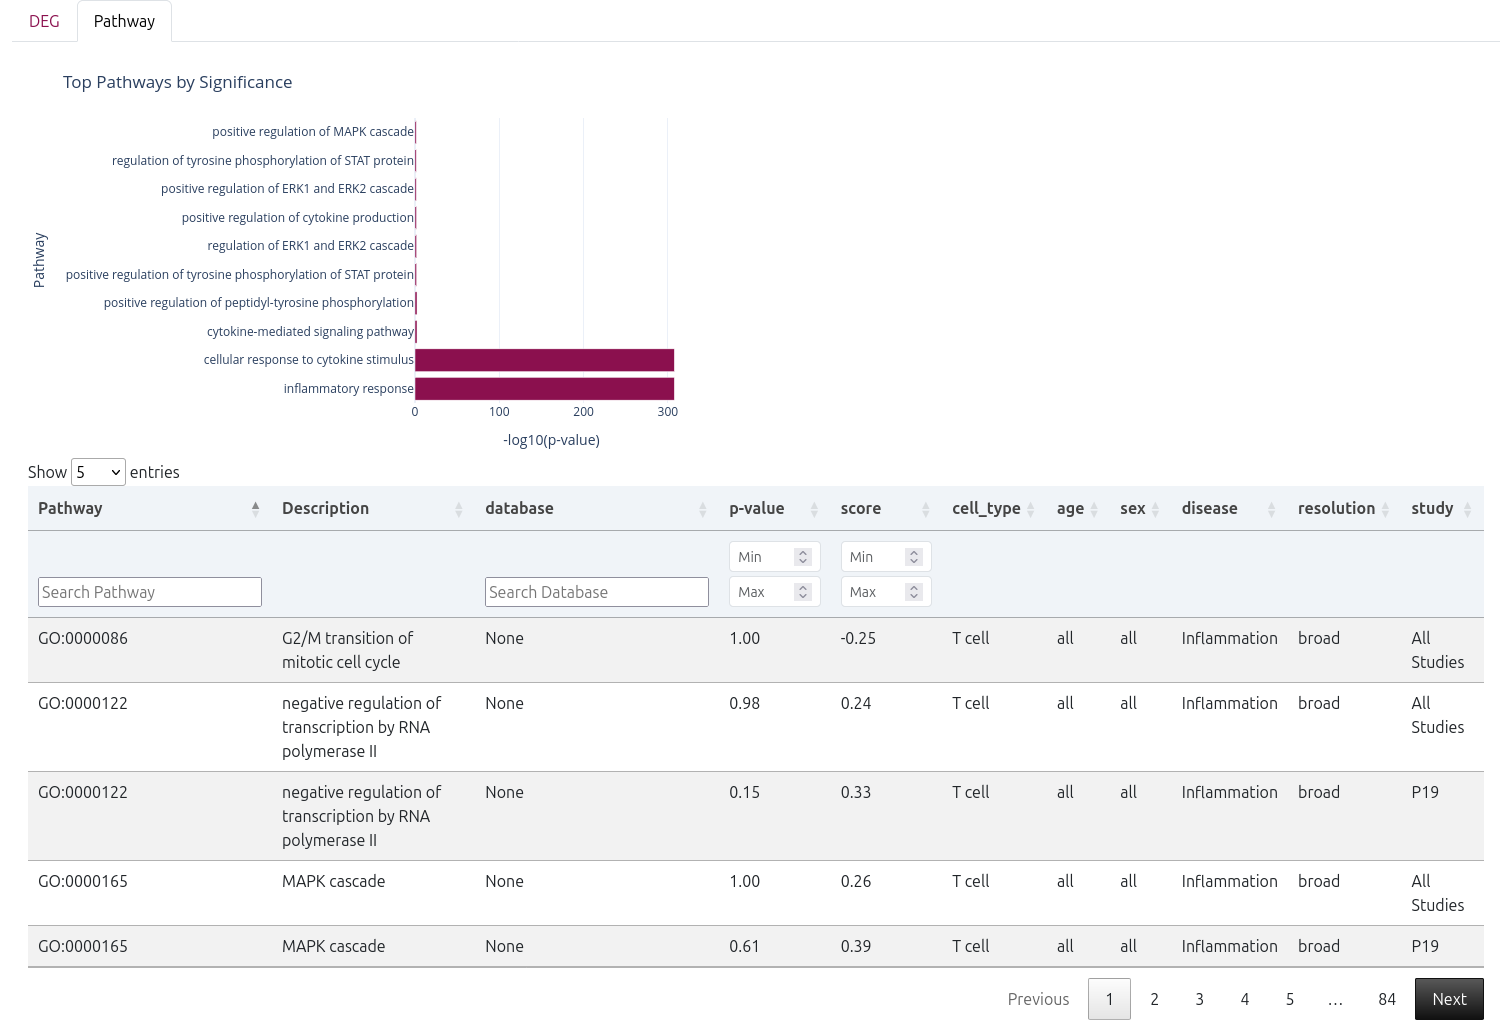
📊 Pathway Enrichment Analysis
Following the DEGs, a bar plot displays the top enriched pathways, ranked by statistical significance.
A detailed pathway table is also provided, including:
- Pathway - Pathway name
- Description - Detailed pathway description
- Database - Source database (e.g.,
BP) - p-value - Statistical significance
- Score - Enrichment score (calculated using GSEA)
- Cell Type - Cell type analyzed
- Age - Age group analyzed
- Sex - Sex group analyzed
- Disease - Disease condition compared
- Resolution - Cell type annotation resolution used
- Study - Study identifier
Cell Type Overview
The Cell Type Overview page provides an interactive UMAP visualization of all cell types in the dataset, allowing you to explore cell type distributions, proportions, and gene expression patterns.
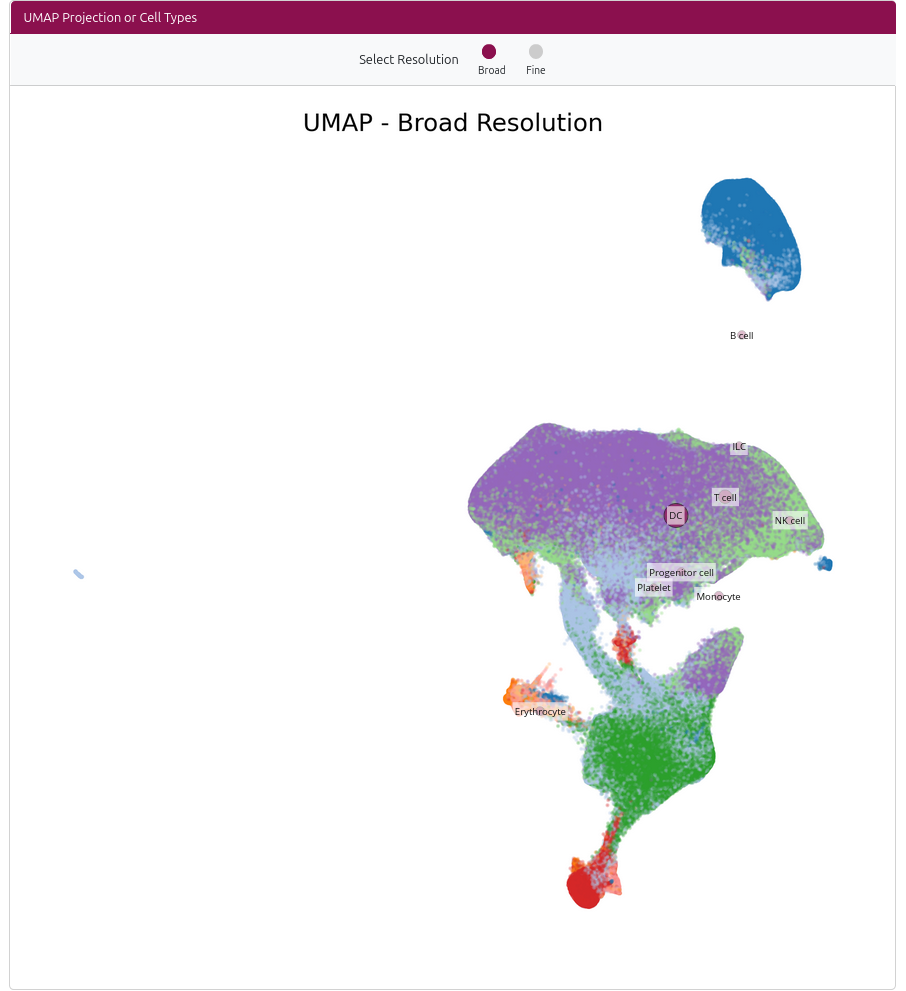
🗺️ Interactive UMAP Visualization
The main feature is an interactive UMAP plot showing all cell types:
- Resolution Selection: Toggle between broad (major cell types) and fine (detailed subtypes) resolution
- Interactive Dots: Each dot represents a cell type, sized by the number of cells
- Click to Select: Click on any dot to view detailed information about that cell type
- Cell Type Information: Selected cell types show cell count and proportion of the dataset
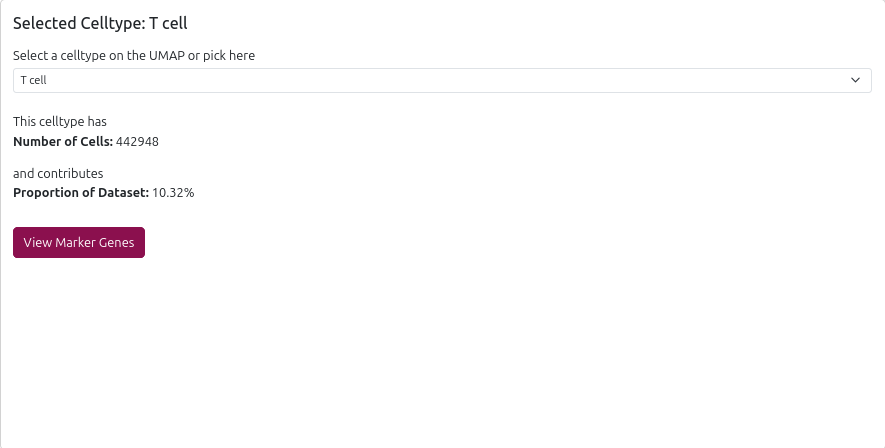
📊 Cell Type Details Panel
When you select a cell type, the right panel displays:
- Cell Count: Number of cells of this type in the dataset
- Proportion: Percentage of total cells
- Marker Genes Link: Direct access to marker gene analysis for this cell type
- Dropdown Selection: Alternative way to select cell types
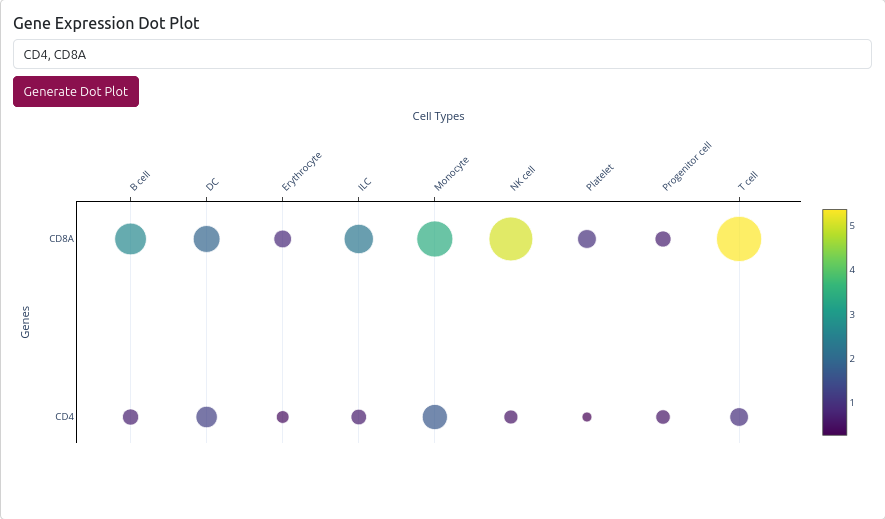
🧬 Gene Expression Dot Plot
The page also includes a gene expression dot plot feature:
- Gene Input: Enter up to 10 genes (comma-separated)
- Resolution Selection: Choose broad or fine resolution for analysis
- Interactive Plot: Shows gene expression across cell types
- Error Handling: Provides suggestions for gene names not found
💡 Use Cases
- Cell Type Exploration: Discover the diversity of immune cell types in the dataset
- Proportion Analysis: Understand the relative abundance of different cell types
- Gene Expression Validation: Verify expected gene expression patterns in specific cell types
- Marker Gene Discovery: Use the dot plot to identify cell type-specific markers
Pro Tip
Start with the broad resolution to get an overview of major cell types, then switch to fine resolution to explore detailed subtypes. Use the example links on the homepage to quickly access specific cell types like Memory CD8 T cells.
Marker Comparison
The Cell Type Markers section allows you to explore both known and dataset-derived marker genes for specific immune cell types.
🎛️ Selection Options
To begin, choose the following from the sidebar:
- Cell Type Resolution: Broad or Fine
- Cell Type: Select the specific population of interest
- Genes: (Optional) Enter a comma-separated list of genes to filter by
Click "Filter Marker Tables" to update the results based on your selection.

📊 Marker Genes in Dataset
The first output is a marker gene table derived from our PBMC dataset. This table displays:
- Gene: The marker gene
- Cell Type: The target immune cell type
- logFC: Log₂ fold change compared to other cell types
- Adjusted p-value: FDR-corrected significance value
These represent high-confidence markers specific to the selected cell type.
☁️ Cell Type WordCloud
Below the marker table, a WordCloud visualizes cell types that are frequently and strongly associated with the selected genes. Larger font size indicates stronger or more frequent association.
📘 Gene × Database Summary
The second table provides a summary matrix showing whether each gene appears in major cell marker databases:
- ✅ = Gene is listed in the database
- ❌ = Gene is not listed
Columns include:
- Gene
- CellMarker
- Human Protein Atlas (HPA)
- MSigDB Immune
- PanglaoDB
This table enables cross-referencing of dataset-derived markers with curated resources.
📚 Database Annotations
The third and final table shows detailed database annotations for your selected genes:
- Gene
- Database: e.g., MSigDB Immune, CellMarker, etc.
- Indicated Cell Type: The associated immune cell type from the database
This helps validate candidate markers or identify discrepancies between datasets and public annotations.

Gene Exploration
The Gene Exploration page allows you to investigate the expression patterns of specific genes across different cell types and biological conditions. This tool is perfect for validating gene expression patterns, exploring cell type-specific markers, or investigating genes of interest.
🎛️ Gene Selection
To begin your analysis:
- Enter Gene Names: Type gene symbols (e.g.,
CD3D, CD4, IL2) in the text area, one per line or comma-separated (maximum 10 genes) - Select Splitting Options: Choose how to split the data by checking "Disease" and/or "Sex"
- Click Generate Plot: The system will create interactive visualizations
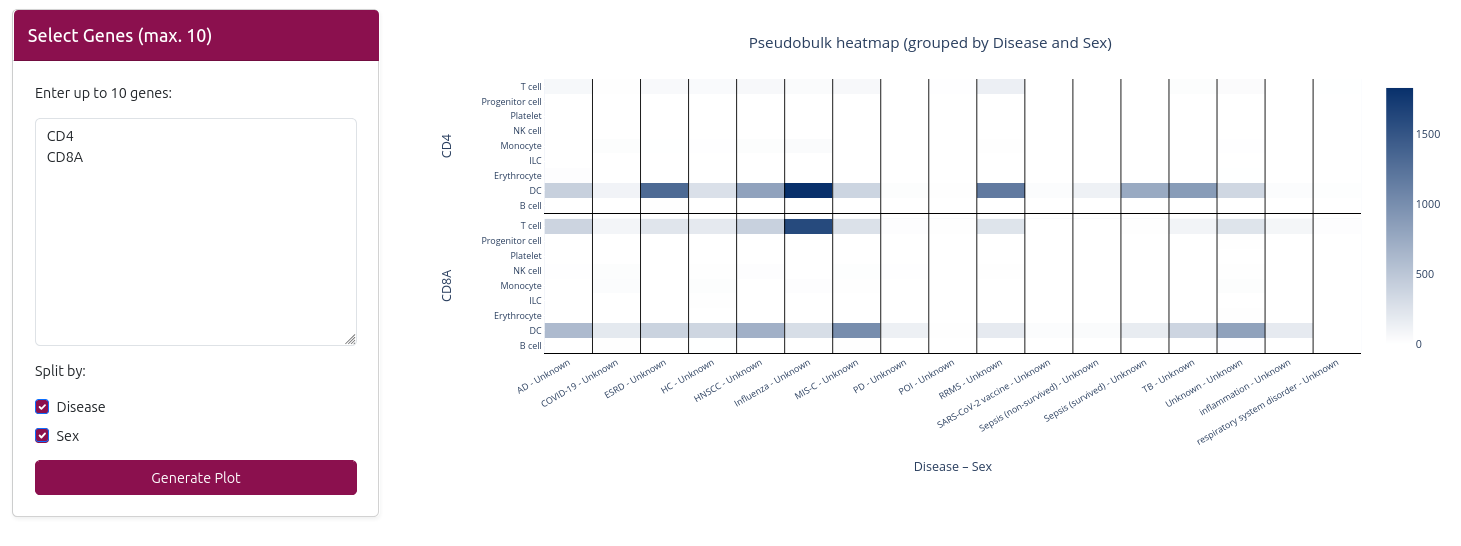
📊 Expression Visualization
The analysis generates an interactive heatmap visualization:
🔥 Heatmap
- X-axis: Cell types (broad resolution)
- Y-axis: Selected genes
- Color intensity: Gene expression level (red = high, blue = low)
- Interactive features: Hover to see exact expression values
- Data splitting: Can be split by disease and/or sex based on your selection
💡 Use Cases
- Marker Validation: Verify that known cell type markers are expressed in expected cell types
- Gene Discovery: Explore expression patterns of novel genes
- Comparative Studies: Compare expression of related genes across cell types
Pro Tip
Use the example links on the homepage to quickly explore common immune genes like CD3D, CD4, or IL2. These examples demonstrate typical expression patterns across PBMC cell types.
TCR/BCR (V(D)J) Analysis
The TCR/BCR (V(D)J) Dashboard provides comprehensive analysis of T-cell and B-cell receptor repertoires, including clonotype diversity, V/J gene usage, and top clones. This tool is essential for understanding adaptive immune responses and clonal expansion patterns.
🎛️ Sample Selection
The dashboard allows you to:
- Select Specific Samples: Choose individual samples from the dropdown to analyze their TCR/BCR repertoires
- View All Samples: Select "All samples" to see aggregated statistics across the entire dataset
- Sample Metadata: When a specific sample is selected, metadata information is displayed including study, project, disease, sex, and age

📊 Key Metrics & Visualizations
📈 Key Performance Indicators (KPIs)
- Total Cells: Number of cells with TCR/BCR data
- Total Samples: Number of samples analyzed
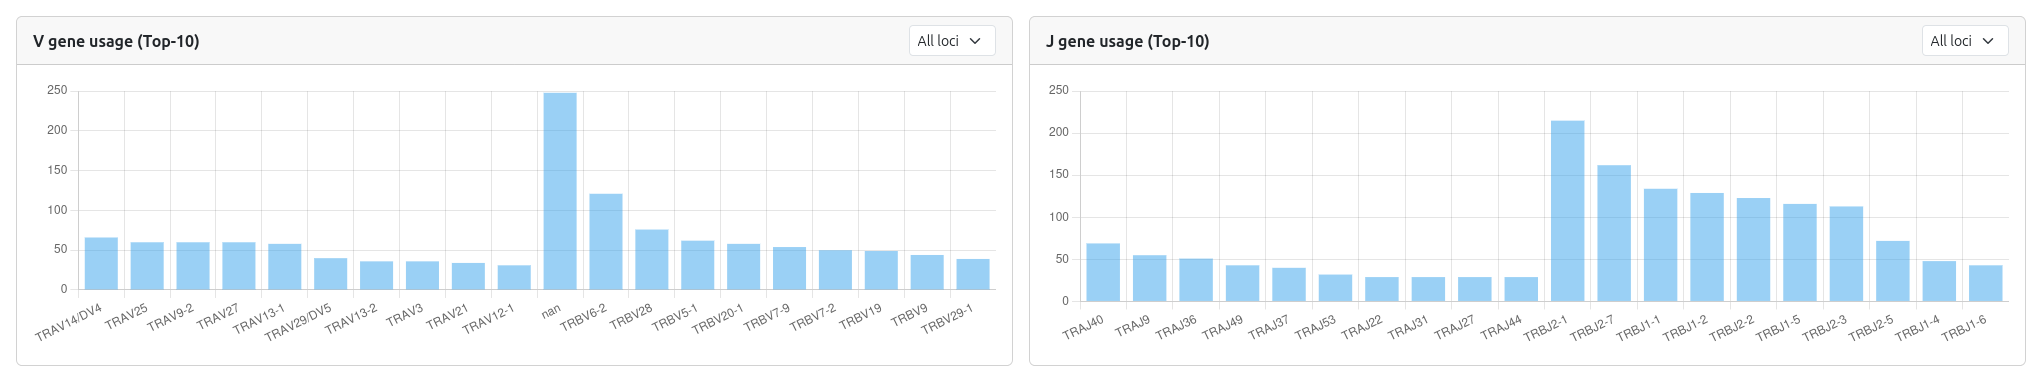
🧬 V Gene Usage
- Bar Chart: Shows the frequency of V gene usage across the selected sample(s)
- Locus Filtering: Filter by specific loci (TRA, TRB, IGH, IGK, IGL)
- Top 10 Display: Focuses on the most frequently used V genes
🧬 J Gene Usage
- Bar Chart: Displays J gene usage patterns
- Locus Filtering: Same filtering options as V gene usage
- Comparative Analysis: Compare J gene usage between samples
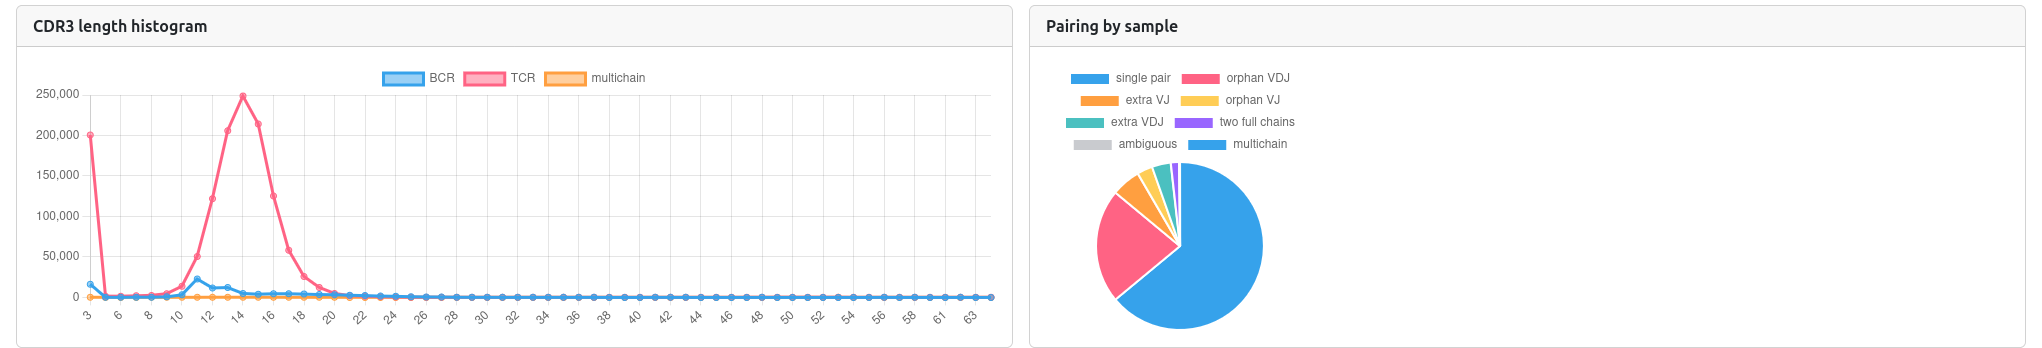
📏 CDR3 Length Distribution
- Histogram: Shows the distribution of CDR3 sequence lengths
- Sample Comparison: Compare CDR3 length patterns between samples
- Biological Insights: CDR3 length can indicate T-cell maturation and selection
🔗 Chain Pairing
- Pairing Matrix: Shows the frequency of αβ chain pairings in T cells
- Diversity Assessment: Helps understand TCR diversity and clonal expansion
🎯 Top Clonotypes
The Top Clonotypes table provides detailed information about the most frequent TCR/BCR clones:
- Clone ID: Unique identifier for each clonotype
- Cell Count: Number of cells with this specific clonotype
- CDR3 Sequence: The actual CDR3 amino acid sequence
- View Chains: Click to see detailed chain information for the clonotype
When a specific sample is selected, the table shows "What are the top TCR clones in sample [sample_name]?" providing context about which sample's data you're viewing.

💡 Use Cases
- Immune Response Analysis: Study clonal expansion during infection or vaccination
- Disease Research: Compare TCR/BCR repertoires between healthy and diseased states
- Sample Quality Control: Assess the quality and diversity of TCR/BCR data
- Comparative Studies: Compare receptor usage patterns across different samples or conditions
Pro Tip
Use the example link on the homepage to quickly explore TCR clones in a specific sample. The sample metadata box provides important context about the biological sample you're analyzing.
Surface Proteins Analysis
The Surface Proteins page allows you to explore protein expression patterns across different diseases and cell types. This tool is particularly useful for understanding cell surface marker expression and identifying potential therapeutic targets.
🎛️ Protein Selection
To begin your analysis:
- Select Protein: Choose a surface protein from the dropdown menu (e.g., CD56, CD3, CD4)
- Select Cell Type: Choose a specific cell type to focus on, or select "All" for overall expression
- View Results: The plot automatically updates to show expression patterns
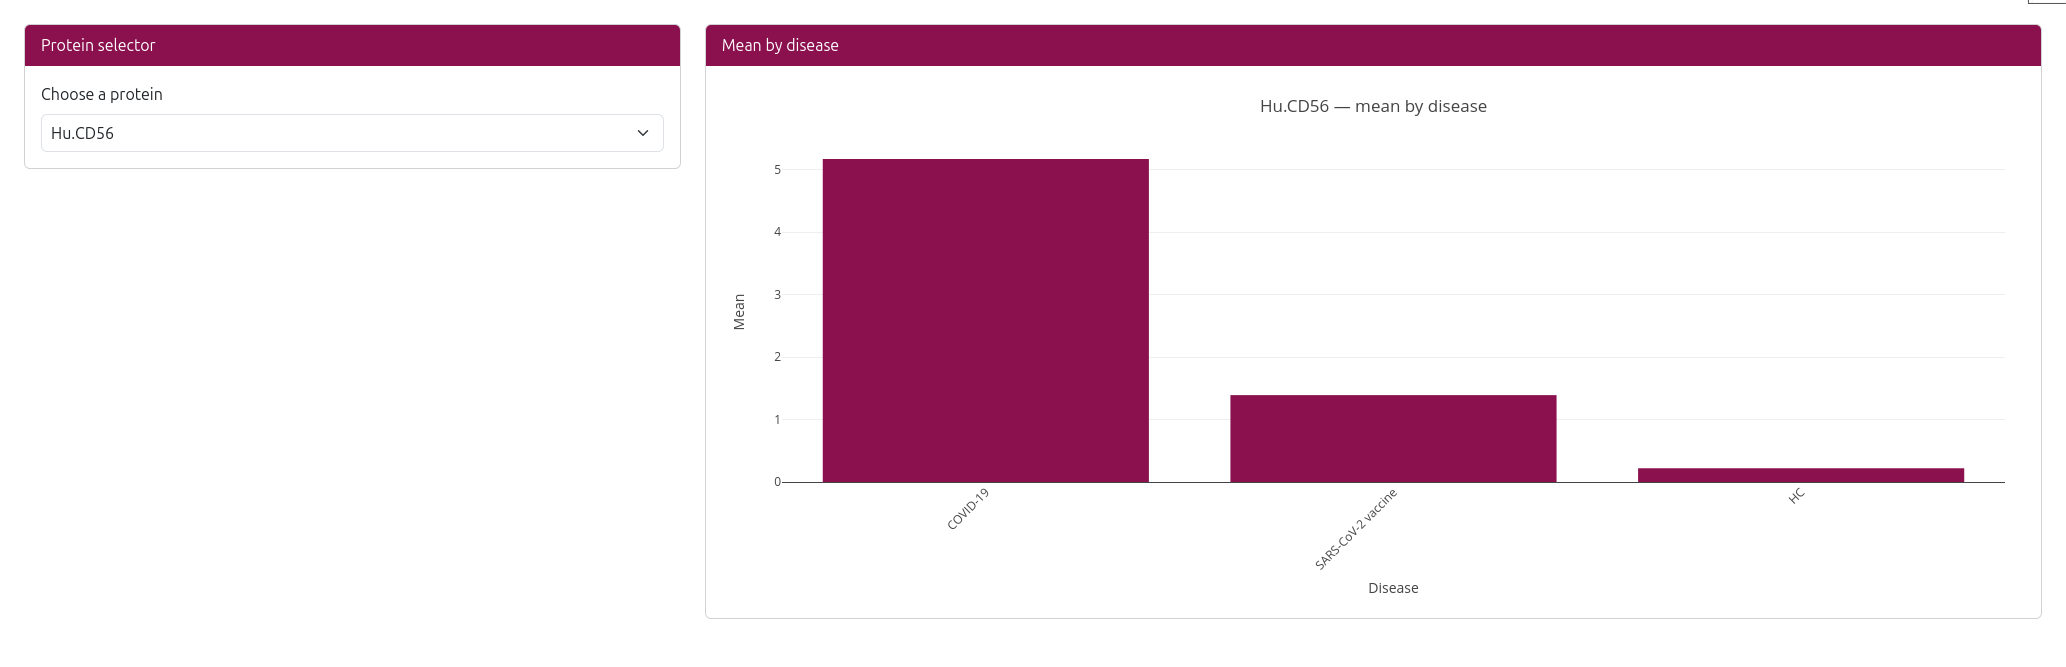
📊 Expression Visualization
The analysis generates an interactive bar chart showing:
- X-axis: Disease conditions (e.g., COVID-19, Healthy, Alzheimer's disease)
- Y-axis: Mean protein expression level
- Bars: Ordered by expression level (highest to lowest)
- Interactive features: Hover over bars to see exact expression values
📋 Available Proteins
The dataset includes a comprehensive set of surface proteins commonly used in immunology research:
- CD Markers: CD3, CD4, CD8, CD56, CD19, CD14, etc.
- Activation Markers: CD25, CD69, CD38, etc.
- Co-stimulatory Molecules: CD28, CD80, CD86, etc.
- Adhesion Molecules: CD11a, CD11b, CD11c, etc.
💡 Use Cases
- Biomarker Discovery: Identify proteins that are differentially expressed in specific diseases
- Therapeutic Target Identification: Find surface proteins that could be targeted for therapy
- Cell Type Characterization: Understand the surface protein profile of different cell types
- Disease Comparison: Compare protein expression patterns across different disease conditions
Pro Tip
Use the example link on the homepage to quickly explore CD56 expression in NK cells. This demonstrates how surface protein expression can vary across different cell types and disease conditions.
Cell–Cell Communication
This section will outline how to interpret ligand–receptor interaction results, including summary plots and per-pair tables.
Coming soon: example analyses and visuals.
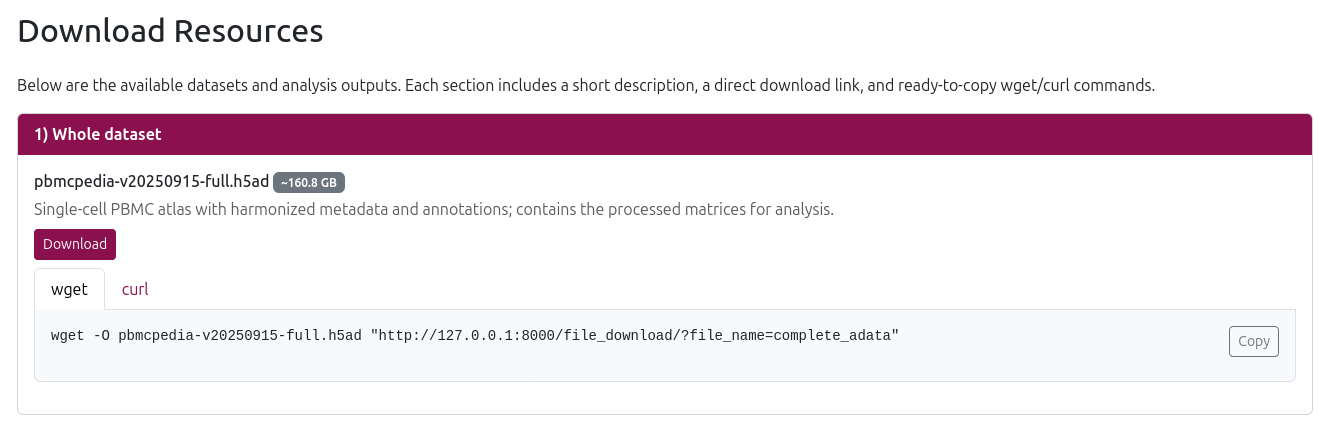
Downloads
In the Downloads section, you can access all major data outputs and resources generated from the PBMCpedia project. These files support further analysis, benchmarking, or model development in your own research environment.
🧬 1. Whole Dataset (.h5ad)
Download the complete single-cell PBMC dataset in AnnData (.h5ad) format (~160.8 GB), including:
- Quality-controlled and filtered cells
- Gene expression matrix (normalized, log-transformed, and scaled)
- Cell type annotations (multiple resolutions)
- Sample and donor metadata
- Harmony-integrated embeddings for batch correction
This dataset is ready for downstream analysis in Python tools like Scanpy or scvi-tools.
🧪 2. Pseudobulks (.h5ad)
Download pseudo-bulk versions of the dataset where gene expression is aggregated per cell type:
- Broad resolution (~245 MB) - Aggregated by broad cell type categories
- Fine resolution (~287.3 MB) - Aggregated by fine-grained cell type annotations
This format is useful for bulk-like differential expression, pathway enrichment, or machine learning on summarized profiles.
📊 3. Analysis Results (.csv)
Download pre-computed analysis results:
- DEG Results (~20.1 KB) - Differential gene expression results comparing disease vs. control across cell types
- Pathway Enrichment (~906.5 KB) - Pathway enrichment summary across cell types/contrasts with core stats (NES/FDR)
Ideal for downstream filtering, visualization, or integration with gene set databases.
🧬 4. VDJ Sequencing Data
Download TCR/BCR repertoire data:
- VDJ AIRR Data - TCR/BCR sequencing data in AIRR format (parquet format for efficient storage)
- VDJ Cell Metadata - VDJ cell metadata and annotations (compressed CSV format)
🧪 5. Protein/ADT Data (.csv)
Download protein expression data:
- Protein Means by Disease - Mean protein expression by disease condition
All resources are made available to support transparent, reproducible, and scalable research on immune cells in health and disease.
API
PBMCpedia provides a RESTful API for programmatic access to its data and analysis results. This section outlines the available endpoints and how to use them.
🔗 API Endpoints
In production, all endpoints are served under the base path /pbmcpedia. Main endpoints:
/pbmcpedia/api/v1/degs/- Differential gene expression/pbmcpedia/api/v1/pathways/- Pathway enrichment/pbmcpedia/api/v1/metadata/- Sample metadata/pbmcpedia/api/v1/gene_expr_celltype/- Gene expression per cell type/pbmcpedia/api/v1/marker_table_ds/- Dataset-specific marker genes/pbmcpedia/api/v1/protein_list/- Available proteins/ADT markers/pbmcpedia/api/v1/adt_summary_api/- ADT summary statistics/pbmcpedia/api/v1/chains/by_clone- TCR/BCR chain info for clones/pbmcpedia/api/v1/ping/- API health check
🛠️ Example Requests
Below are example requests using curl and Python (using requests library).
🔗 curl Examples
To get differential gene expression results:
curl -G 'https://web.ccb.uni-saarland.de/pbmcpedia/api/v1/degs/' \
  --data-urlencode 'cell_type=CD4+ T cell' \
  --data-urlencode 'disease=COVID-19' \
  --data-urlencode 'limit=10' \
  --data-urlencode 'offset=0'
To get pathway enrichment results:
curl -G 'https://web.ccb.uni-saarland.de/pbmcpedia/api/v1/pathways/' \
  --data-urlencode 'cell_type=CD4+ T cell' \
  --data-urlencode 'resolution=broad' \
  --data-urlencode 'limit=10'
To get sample metadata:
curl -G 'https://web.ccb.uni-saarland.de/pbmcpedia/api/v1/metadata/' \
  --data-urlencode 'study=PRJNA1040889' \
  --data-urlencode 'limit=10'
Health check:
curl 'https://web.ccb.uni-saarland.de/pbmcpedia/api/ping/'🐍 Python Example
Using the requests library:
import requests

base_url = "https://web.ccb.uni-saarland.de/pbmcpedia"

# DEGs
resp = requests.get(f"{base_url}/api/v1/degs/", params={
    "cell_type": "CD4+ T cell",
    "disease": "COVID-19",
    "limit": 10,
})
print(resp.json())

# Pathways
resp = requests.get(f"{base_url}/api/v1/pathways/", params={
    "cell_type": "CD4+ T cell",
    "resolution": "broad",
    "limit": 10,
})
print(resp.json())

# Metadata
resp = requests.get(f"{base_url}/api/v1/metadata/", params={
    "study": "PRJNA1040889",
    "limit": 10,
})
print(resp.json())
💡 Tips
- Most endpoints support query parameters for filtering (e.g.,
cell_type,disease,study) - Use the
/api/ping/endpoint to check if the API is available - For large datasets, consider using the download endpoints instead of API calls
- All API responses are in JSON format
- API docs:
https://web.ccb.uni-saarland.de/pbmcpedia/api/docs/