HERA
Host Element Reference-based Aligner
The webserver for plasmid visualization using BLAST alignment against reference sequences.
General
HERA webserver allows to compare your plasmid sequences against references using BLAST alignment, explore your results through dynamic circular visualizations, and gain insights into their underlaying genetic architecture. Easy-to-use web interface inspired by tools like BRIG, but designed for accessibility.
📑 Table of Contents
1. Understanding the Visualization
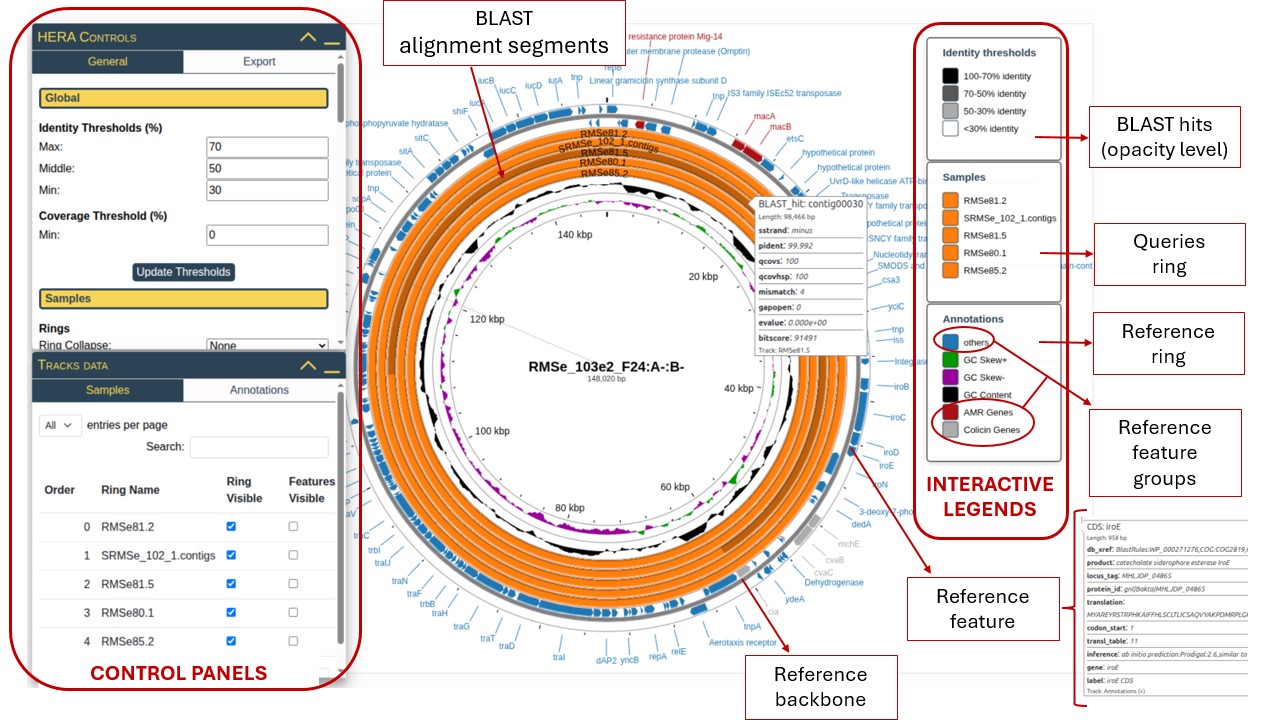
1.1. Main Components
The HERA visualization consists of several concentric rings, each representing different types of genomic data:
- Reference Backbone: The innermost thin circle representing the reference genome's physical structure with position markers showing base pair coordinates.
- Reference Ring: The blue ring containing annotated features from your GenBank file (genes, proteins, regulatory elements). Click on "others" in the Annotations legend to control visibility.
- Additional Analysis Tracks: Inner colored rings (black, green, purple) showing optional analyses like GC Content and GC Skew.
- Query Rings: Orange rings representing your submitted FASTA sequences. Each query gets its own ring, shown in the "Samples" legend. Each of the query rings contains BLAST Alignment Segments , indicating regions of similarity. The opacity reflects alignment quality based on percent of identity.
- Feature Labels: Text labels around the perimeter showing gene names, protein products, or other annotations from your reference file.
1.2. Color Coding System
- 100-70% identity: Solid dark blue (high similarity, fully opaque)
- 70-50% identity: Medium opacity (moderate similarity)
- 50-30% identity: Light opacity (low similarity)
- <30% identity: Invisible (below threshold)
The opacity level of BLAST alignment segments directly corresponds to the percent identity score. This visual encoding allows you to quickly identify high-quality alignments (dark, opaque) versus more distant relationships (light, transparent).
2. Control Panels
The left-side control panel provides comprehensive customization through two main sections: HERA Controls and Tracks Data.
2.1. HERA Controls
Identity Thresholds (%)
Define how alignment quality is categorized and displayed:
- Max (default: 70): Upper threshold for high-quality matches
- Middle (default: 50): Mid-range similarity cutoff
- Min (default: 30): Minimum similarity to display
Update Thresholds. Features are recolored based on percent identity:
- Above Max → fully opaque (100% alpha)
- Between Max and Middle → 66% opacity
- Between Middle and Min → 33% opacity
- Below Min → hidden from view
Coverage Threshold (%)
Min (default: 0): Set minimum query coverage required to display an alignment. This filters out partial or short alignments that may be spurious. Higher values show only alignments that cover a substantial portion of the query sequence.
Ring Collapse
Control how features are organized within rings:
- None: Display all features in a single layer (may overlap)
- Strand: Separate forward and reverse strand alignments into different layers
This setting prevents visual overlap and improves clarity when many features align to the same genomic region.
3. Interactive Legends
HERA provides three interactive legends that are automatically generated and update dynamically based on your data and settings.
3.1. Identity Thresholds Legend
Shows the color-opacity gradient used to represent alignment quality. The base color can be customized in the Export tab under "Legends" settings. This legend uses opacity levels to distinguish between different identity ranges.
3.2. Samples Legend
Lists all query sequences (your FASTA submissions) with their assigned colors. Each sample is represented by:
- A colored square (swatch) matching the ring color
- The sample name (from your FASTA file)
- Click any color swatch to open a color picker and customize individual sample colors
- Drag the entire legend to reposition anywhere on the visualization
- Legend automatically updates when you show/hide samples or reorder rings
3.3. Annotations Legend (Reference Feature Groups)
Displays categories of reference genome features. By default, all features are grouped as "others" (shown in blue). You can create custom groups to organize and color-code features by function:
- GC Skew: Shows GC compositional bias
- GC Content: Overall GC percentage
- AMR Genes: Antimicrobial resistance genes
- Colicin Genes: Colicin-related features
- others: All ungrouped annotation features
Create custom groups in the Tracks Data → Annotations → Add Groups tab to highlight specific gene categories (e.g., "Mobile Elements", "Virulence Factors", "Replication").
4. Tracks Data Panel
The bottom control panel provides detailed management of individual rings and features through two tabs.
4.1. Samples Tab
View and manage all query sequence rings with a sortable, interactive table.
| Column | Description | Function |
|---|---|---|
| Order | Numeric position (0 = innermost query ring) | Drag rows to reorder rings from inside to outside |
| Ring Name | Sample identifier from FASTA file | Read-only, displays sequence name |
| Ring Visible | Checkbox to show/hide entire ring | Uncheck to completely hide a sample ring |
| Features Visible | Checkbox to show/hide BLAST alignment segments | Uncheck to show ring scaffold but hide alignments |
- Click and hold any row in the Order column
- Drag it to the desired position
- Drop to reorder
- Visualization and legends update immediately
Use the search box to filter specific samples by name. Adjust "entries per page" to show 5, 10, 15, or All entries for easier navigation when working with many samples.
4.2. Annotations Tab
Browse and control individual annotation features from your reference genome.
Features Table
Displays all annotation features with the following columns:
- Feature Name: Gene/protein identifier (based on selected qualifier in HERA Controls → Annotations tab)
- Label Visible: Toggle individual feature labels on/off using checkboxes
- Groups: Shows assigned functional groups (comma-separated if feature belongs to multiple groups)
Add Groups Table
Create custom functional groupings of annotation features to organize and color-code related genes.
- Navigate to Tracks Data → Annotations → Add Groups
- Select features using checkboxes (multiple selection allowed)
- Enter a descriptive group name (e.g., "Antibiotic Resistance", "Metabolism", "Mobile Elements")
- Click
Create Groupbutton - New group appears in Annotations legend with its own color
- All grouped features share the same color on the visualization
Managing Groups
- Change group colors: Click the color swatch in the Annotations legend to open color picker
- Remove groups: Select features, enter group name, click
Remove Group - Multiple groups: Features can belong to multiple groups; most recent group determines display color
- Removing groups: Doesn't delete features, only removes the group association
5. Exporting and Loading Results
HERA provides comprehensive export capabilities through the Export tab in the Control Panel.
5.1. Save Progress
Create a snapshot of your entire session including all customizations, colors, positions, and settings:
- Click
Save on Serverto store remotely (confirmation message appears)
Click Download Progress to save a .zip file locally containing:
- CGView visualization data (JSON format)
- Session settings (thresholds, styles, positions)
- BLAST alignment results
File name format: {job_id}_HERAproject.zip
5.2. Load Saved Project
- Go to HERA results tab
- Upload your
_HERAproject.zipfile or insert the jobID - Click "Load Project" option
- Visualization reappears with all customizations intact
5.3. Export Images
Generate publication-quality figures in multiple formats with precise control over dimensions and appearance.
Image Area Selection
- Complete Image: Entire visualization including all legends and labels
- Custom: Define specific region using crop controls (Left, Right, Top, Bottom margins)
Background Options
- Transparent: PNG with no background (ideal for overlays in presentations)
- Colored: Select custom background color (white for publications, colored for presentations)
Dimensions & Resolution
Choose units and set precise dimensions:
- Pixels (px): Digital screen resolution
- Centimeters (cm): Print dimensions with DPI calculation
- Inches (in): Print dimensions with DPI calculation
DPI (Dots Per Inch) recommendations:
- 72 dpi: Screen display
- 150 dpi: Draft print quality
- 300 dpi: Publication quality (journals)
- 600 dpi: High-resolution print
File Formats
- PNG: Lossless quality, supports transparency, best for figures
- JPEG: Smaller file size, no transparency, good for presentations
- SVG: Vector format, infinitely scalable, ideal for publications requiring editing
Image Preview
Real-time preview window shows exactly how your exported image will look. Preview updates automatically 400ms after you stop adjusting settings (debounced to prevent lag).
- Format: PNG or SVG
- Background: White (or transparent if overlaying)
- DPI: 300-600
- Unit: Centimeters or Inches (match journal requirements)
- Consider using Custom area to exclude legends, add them in figure editor
Export Process
- Configure all settings (area, background, dimensions, format)
- Review the preview window
- Enter filename (default: "HERA_image")
- Click
Save Image - File downloads automatically with chosen settings
Quick Reference: Common Tasks
| Task | Location | Steps |
|---|---|---|
| Change identity thresholds | Control Panel → General tab → Global | Adjust Max/Middle/Min values, click Update Thresholds |
| Reorder query rings | Tracks Data panel → Samples tab | Drag rows in the Order column to reposition |
| Hide a specific sample | Tracks Data panel → Samples tab | Uncheck "Ring Visible" checkbox for that sample |
| Change feature label text | Control Panel → Annotations tab | Select different qualifier from "Label Qualifier" dropdown |
| Color-code annotations by function | Tracks Data → Annotations → Add Groups | Select features, enter group name, click Create Group |
| Reposition legends | Directly on visualization | Click and drag any legend to new position |
| Change ring or annotation colors | Click legend swatches | Click color square in legend, use color picker, click Done |
| Move reference title | Control Panel → Ref and Map tab | Enable title, configure settings, then drag title element on map |
| Export high-resolution figure | Control Panel → Export tab → Images | Set dimensions (cm/in, 300 dpi), choose PNG/SVG, click Save Image |
| Save project to continue later | Control Panel → Export tab → Data | Click Save on Server or Download Progress |
| Hide all annotations | Control Panel → Annotations tab | Uncheck "Show/Hide All Annotations" master toggle |
| Highlight a specific feature | Tracks Data → Annotations tab | Hover mouse over feature name in Features table |
Our web server supports a variety of common operating systems and browsers:
| OS | Version | Chrome | Firefox | Microsoft Edge | Safari |
|---|---|---|---|---|---|
| Linux | Ubuntu (64 bit) 24.04.2 LTS | 138.0.7204.49 | 146.0 | N/A | N/A |
| macOS | iPadOS 17.7.10 | 143.0.7499.151 | N/A | N/A | 17.7 |
| Windows | 11 | 143.0.7499.169 | 146.0.1.0 | 143.0.3650.80 | N/A |
For the best experience we recommend to use either Chrome or Firefox.
This website is free and open to all users and there is no login requirement.