
Figure 1: Overall description of the data available.
(a) Exponential growth in available small-RNA NGS dataset.
(b) Non-coding RNA type and corresponding number included in dataset from human (hsa) and mouse (mmu).
(c) No. of samples from each dataset included in database for human (hsa) and mouse (mmu).
(d) No. of samples corresponding to tissue, extracellular vesicle and cell line from both human and mouse.
(e) No. of samples corresponding to sex. Samples without sex data were labelled “Unknown”. “Pooled” refers to samples where both Male and Female samples were combined.
(f) Lollipop plot showing the number of samples corresponding to each organ group from human and mouse. The columns are split based on if the organ group was found in only human, both human and mouse and only in mouse. For each label on the y-axis the exact counts are mentioned as (human samples | mouse samples) next to the organ group.
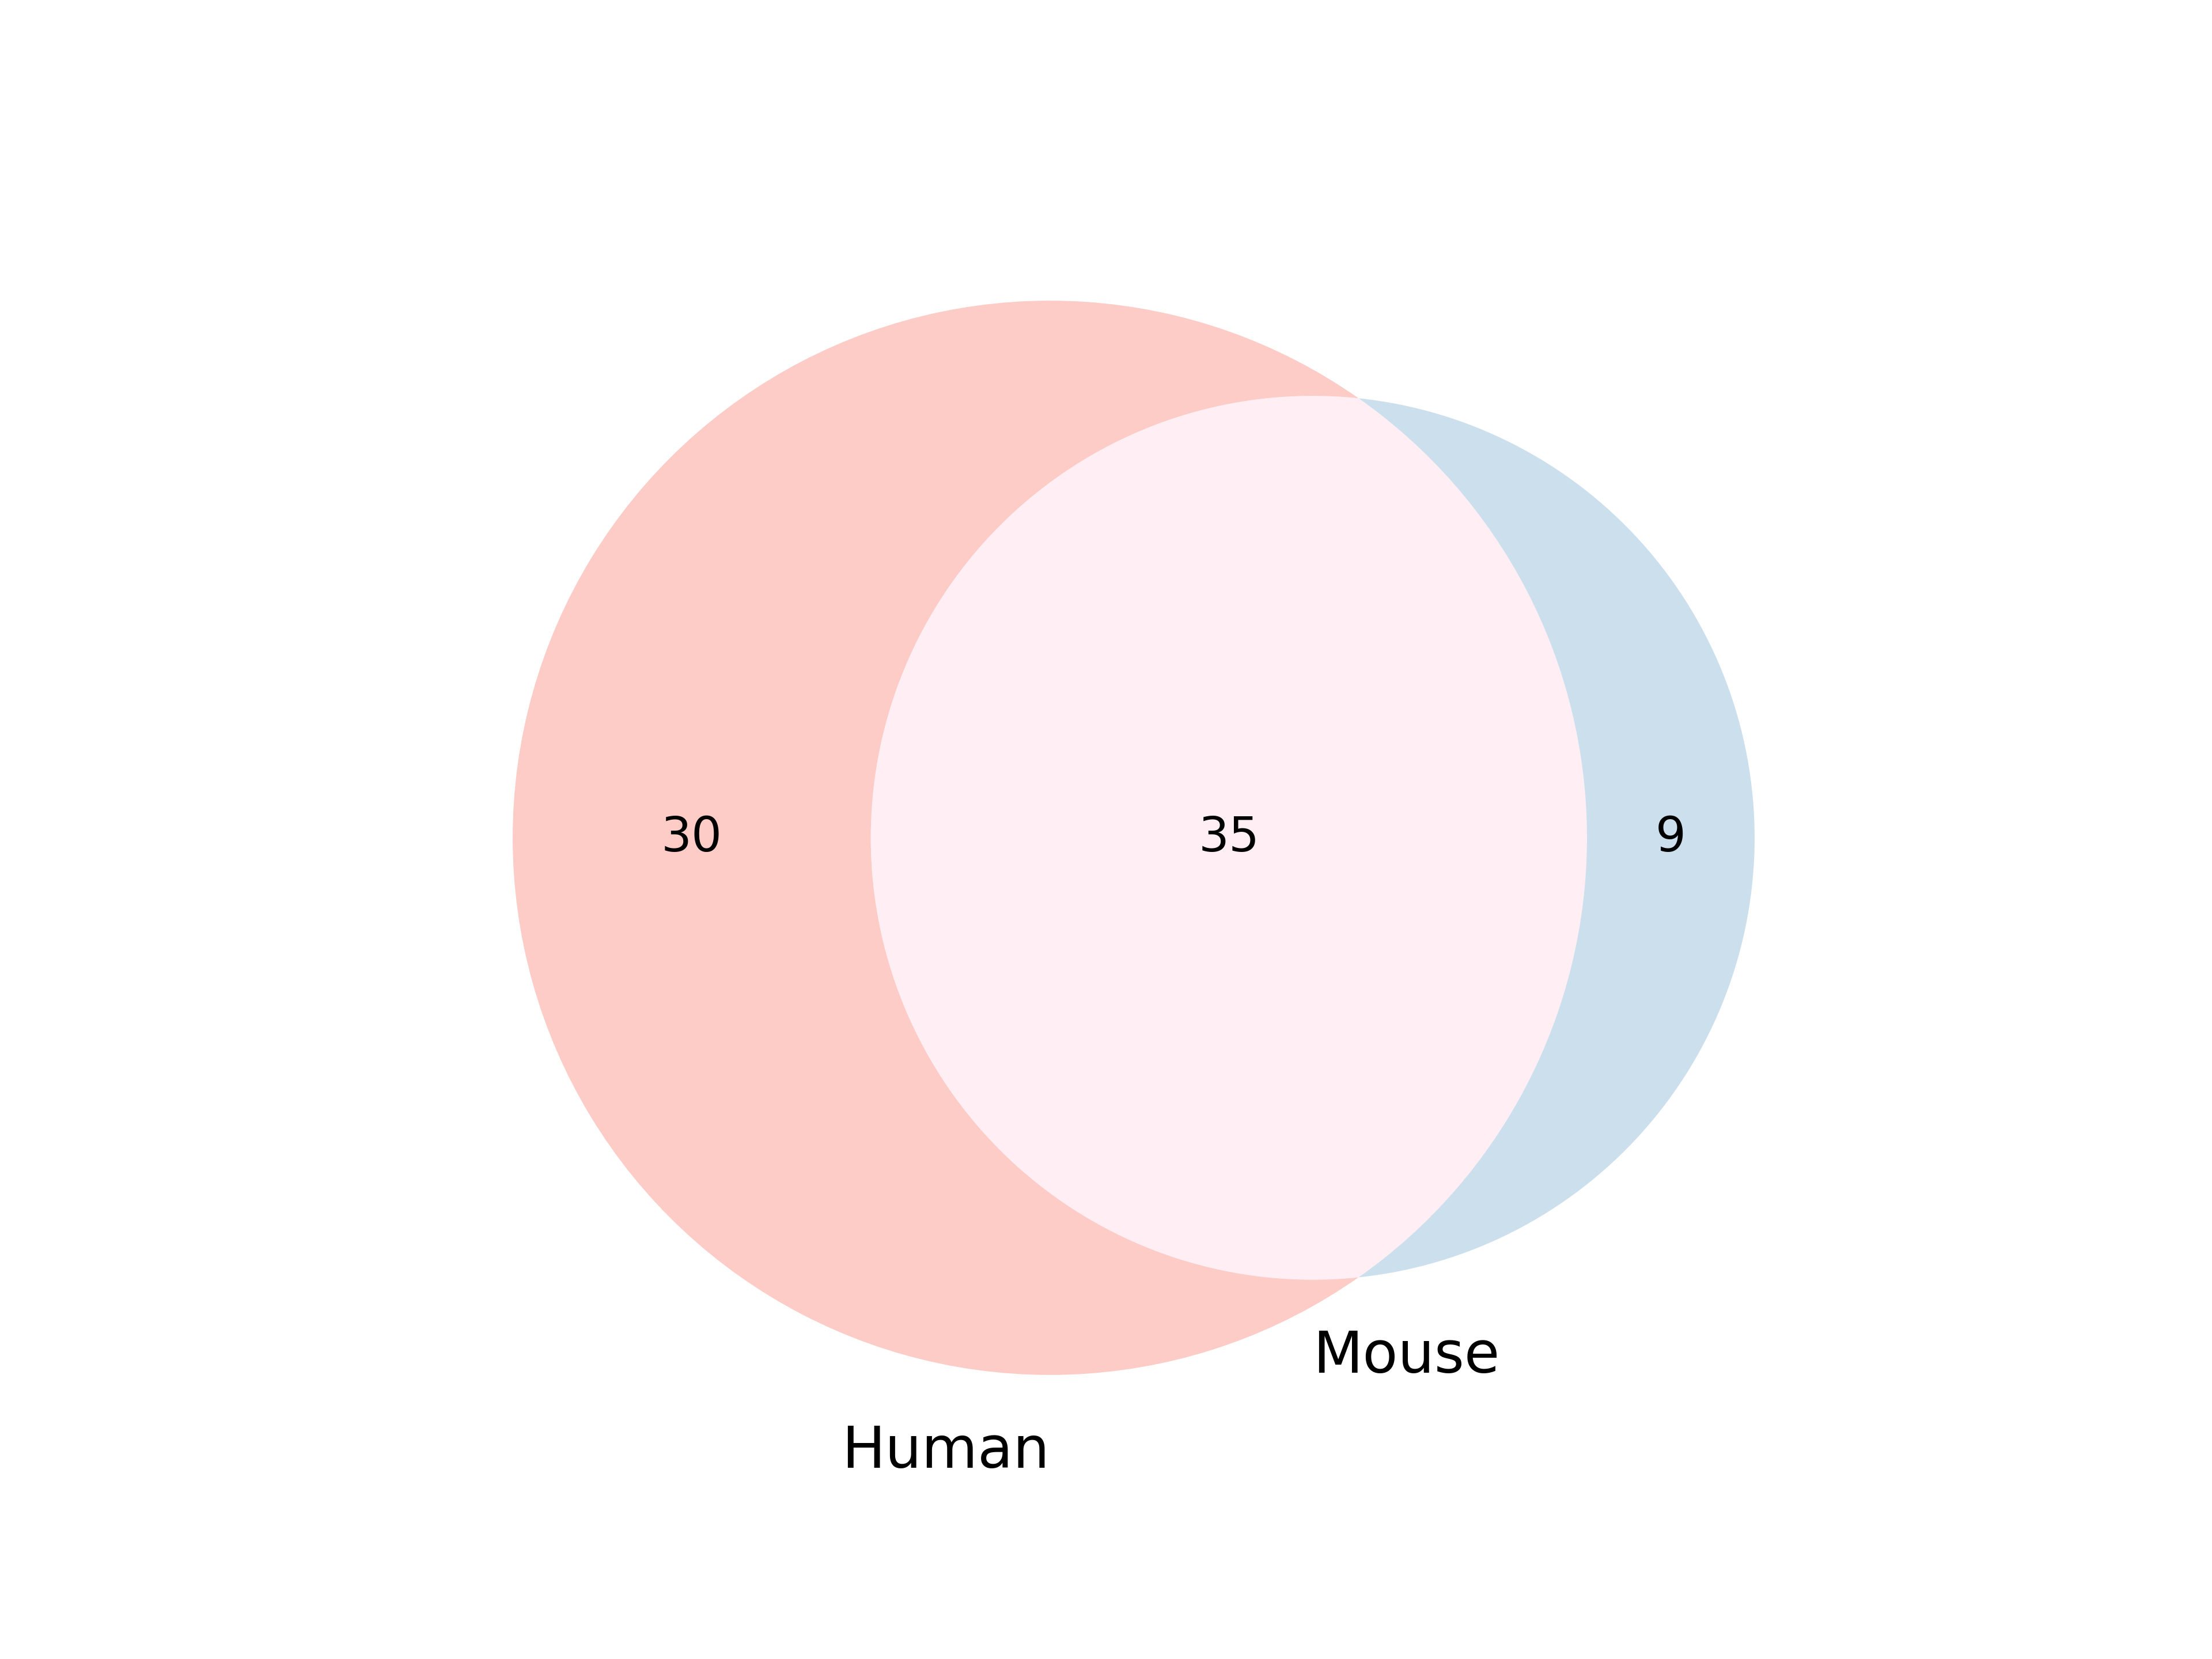
(g) Venn diagram of organ common between and exclusive to human and mouse sets based on tissue subset from d.
Figure 2: TSi and expression summary of non-coding RNA for tissue subset.
(a) Comparison between tissue specificity index (TSI) calculated for TissueAtlas v3 (2025) versus the previous iteration of the TissuAtlas.
(b) TSI distribution for all included non-coding RNA groups for the tissue subset of TissueAtlas v3 (2025) for both human (hsa) and mouse (mmu).
(c) UMAP overview of TissueAtlas v3 (2025) human dataset using tissue-specific miRNA set. colored by biotype group.
(d) UMAP overview of TissueAtlas v3 (2025) human dataset using tissue-specific miRNA set. colored by organ group.
(e) UMAP overview of TissueAtlas v3 (2025) mouse dataset using tissue-specific miRNA set. colored by biotype group.
(f) UMAP overview of TissueAtlas v3 (2025) mouse dataset using tissue-specific miRNA set. colored by organ group.
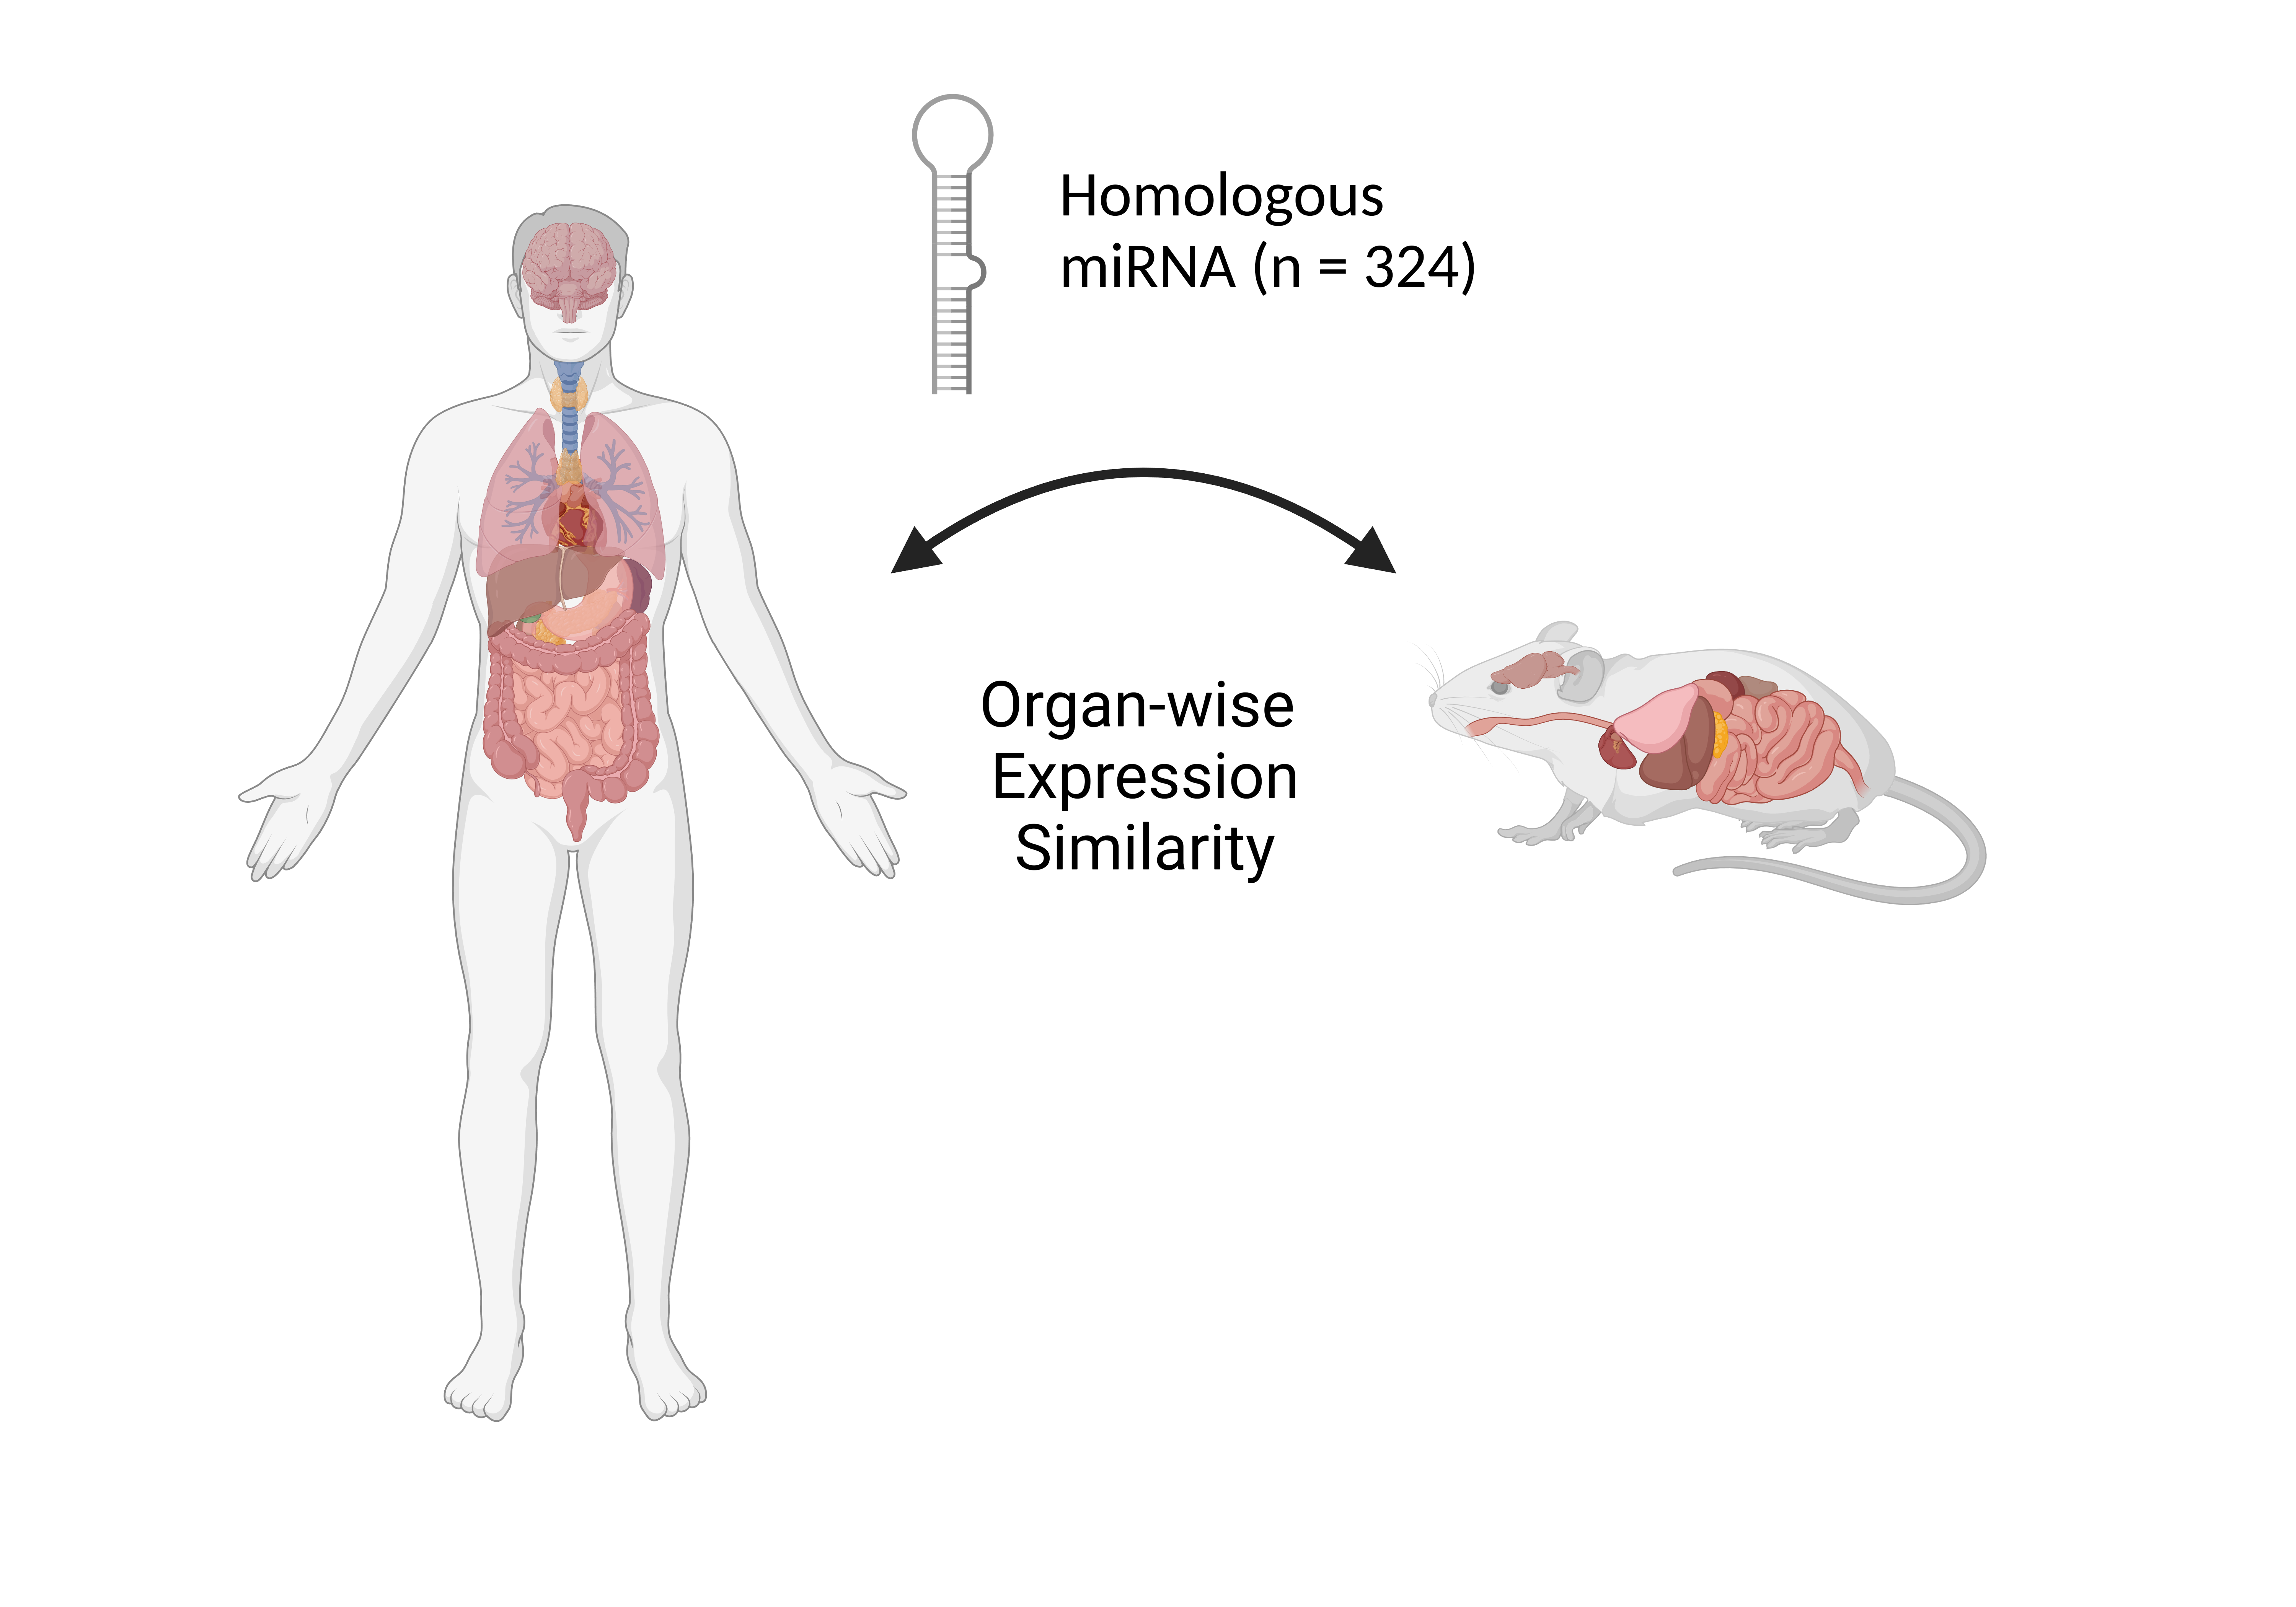
Figure 3: Example use case of cross-species analysis using miRNA set of TissueAtlas v3 (2025).
(a) Select homologous miRNA based on calculations made in the TargetScan dataset. Using this set, we can compare the expression pattern per organ between human and mouse.
(b) Correlation between tissue specificity index (TSI) between human and mouse for the set of homologous miRNA. The miRNA where the max median expression of organ match between human and mouse are colored blue and cluster together towards the top right.
(c) Pairwise cosine similarity distribution of homologous miRNA for harmonized set of 35 organs. Each dot represents a pairwise comparison between a human and mouse organ. The dot colored red is the comparison between the same human and mouse organ. E.g. for the dot corresponding to blood on the x-axis the red dot represent the comparison with blood for mouse.