1. Overview
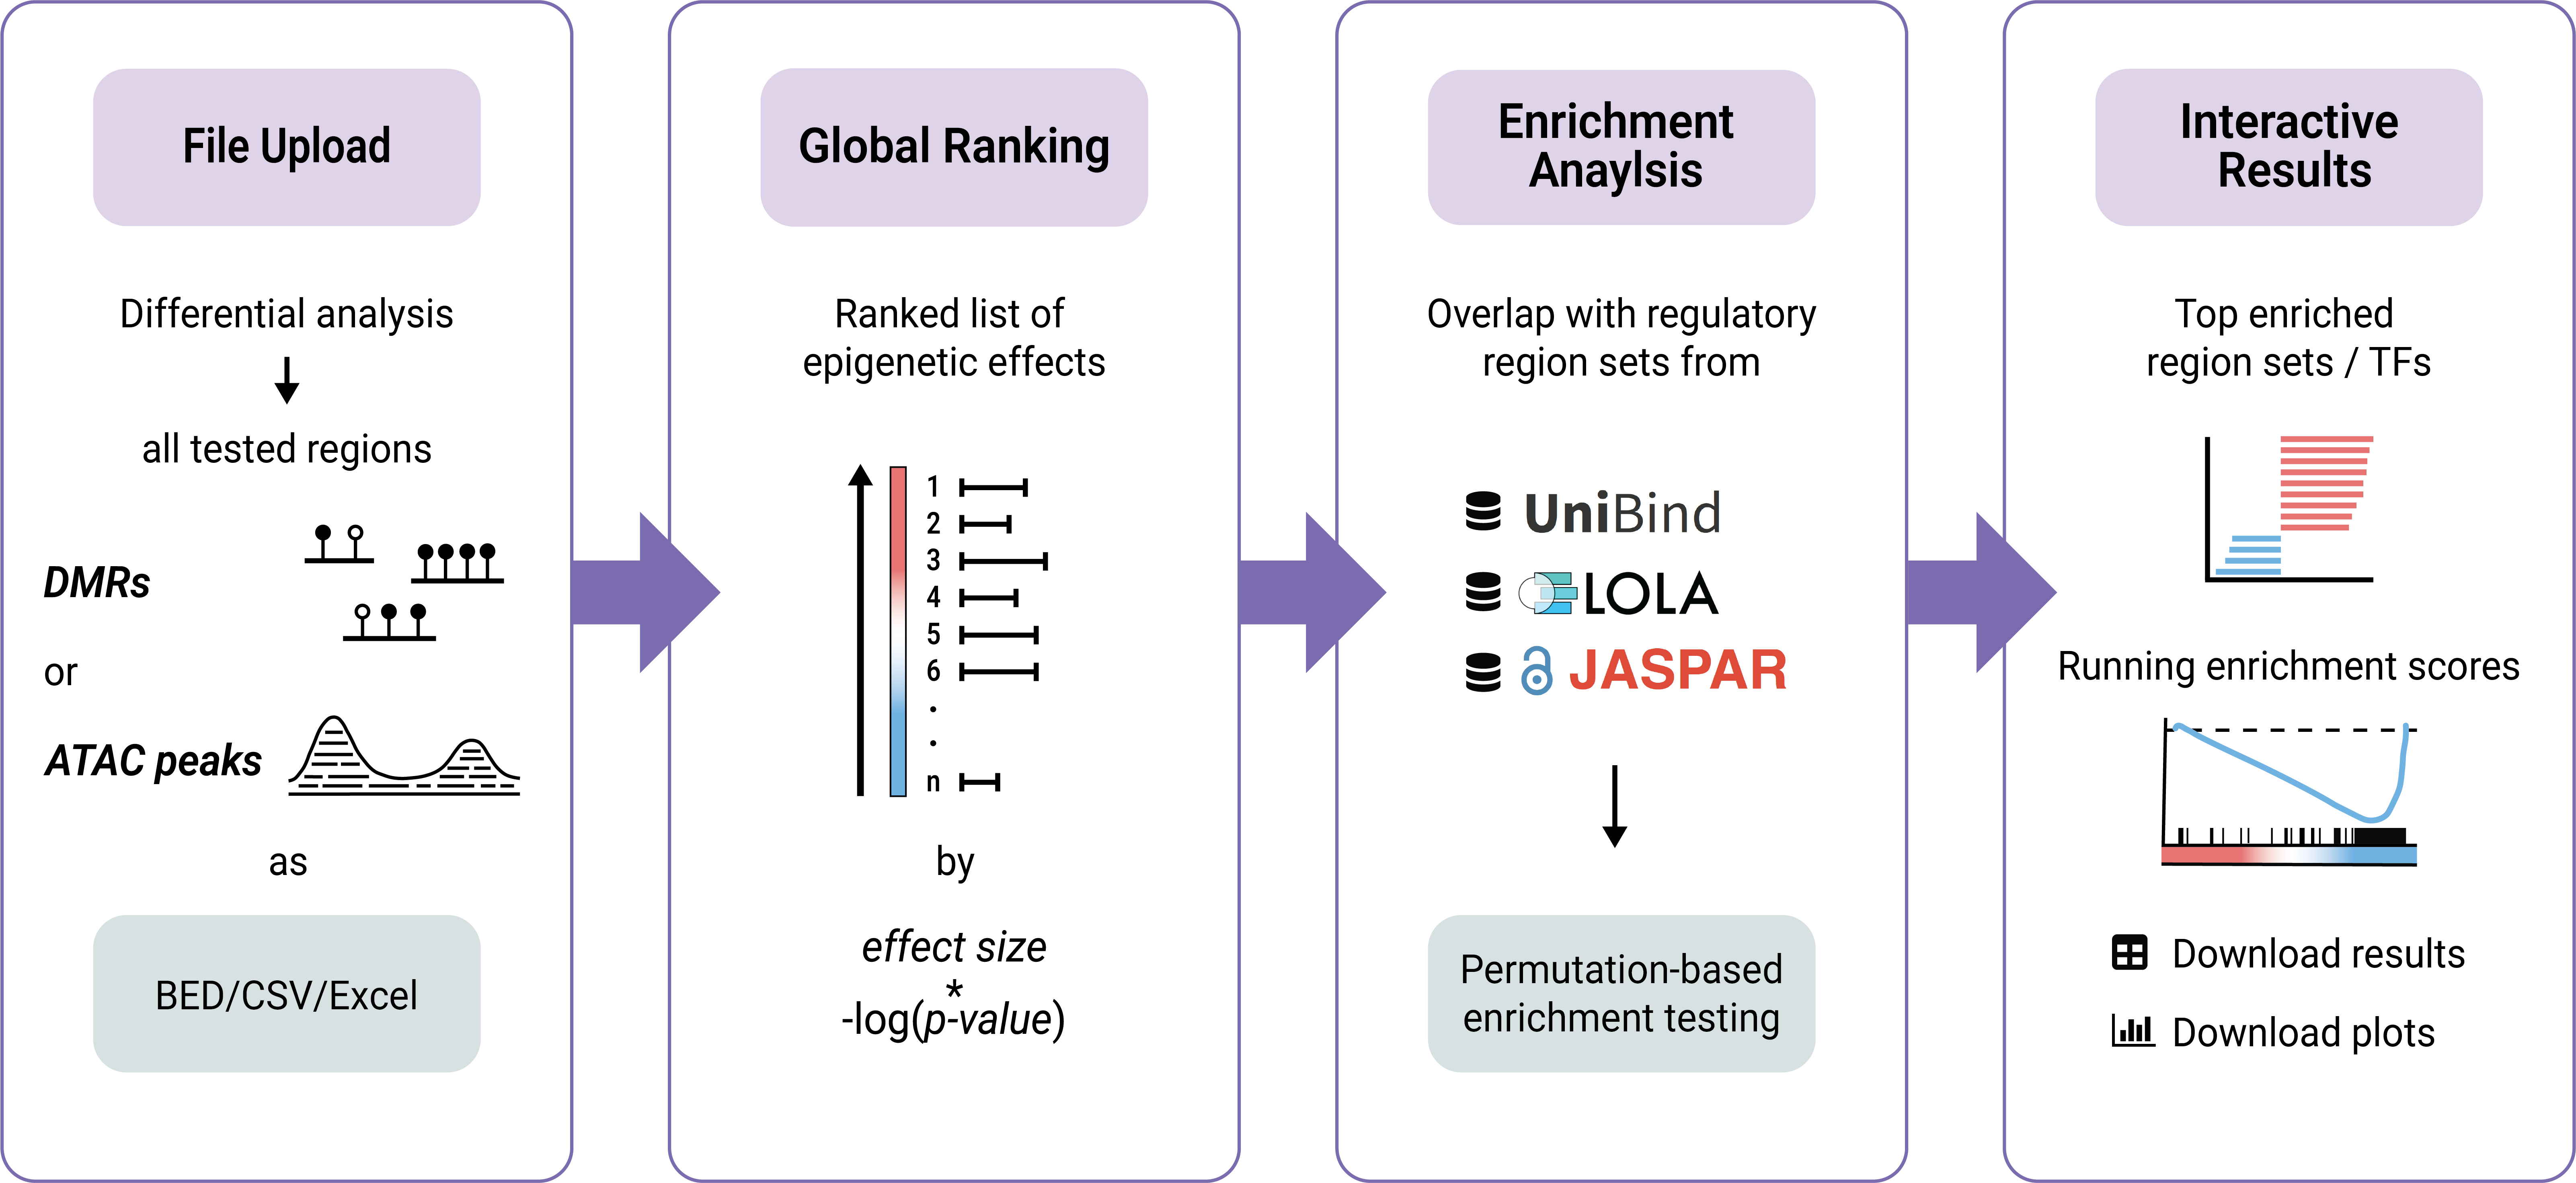
RegRegSEA is a webserver designed for Regulatory Region Set Enrichment Analysis of epigenomic data. It adapts the statistical approach of Gene Set Enrichment Analysis (GSEA) to the epigenomic landscape, enabling testing for the enrichment of regulatory region sets in DNA methylation and chromatin accessibility data.
Instead of analysing a truncated list of statistically significant effects requiring strict cutoffs, RegRegSEA evaluates the entire ranked list of genomic intervals. This sensitive approach allows for identification of transcription factors and regulatory elements associated with subtle but coordinated global shifts in chromatin accessibility or DNA methylation across the genome.
Existing enrichment tools for epigenomic data typically face two major challenges:
- Cutoff-based methods (e.g., LOLA (Sheffield et al., 2016)) require defining a set of "significant" regions based on strict thresholds. This often leads to the loss of subtle, coordinated changes that do not pass strict significance cutoffs but are biologically relevant. This is especially relevant for clinical cohorts with small sample sizes.
- Gene-centric methods (e.g., ebGSEA (Dong et al., 2019)) rely on linking genomic regions to nearby genes to perform pathway analysis. This approach often misses regulatory elements located in enhancers or intergenic regions that are difficult to map to specific target genes.
RegRegSEA bridges this gap by applying a rank-based enrichment analysis directly to genomic coordinates. It can identify transcription factors and regulatory features that are globally associated with your epigenetic profile, even when individual changes are weak and without the bias of gene mapping. This helps generate hypotheses about which upstream regulators might be orchestrating the observed epigenomic landscape.
Supported Databases
RegRegSEA currently supports enrichment analysis for human and mouse data against the following regulatory region set databases:
- UniBind TFBSs: Experimentally validated transcription factor binding sites (TFBSs) derived from thousands of ChIP-seq datasets.
- LOLA Region Databases: A diverse collection including TFBSs (ENCODE, Cistrome), histone modifications (Cistrome), and broader genomic features (UCSC).
- JASPAR: Transcription factor motif matches scanned across the genome (only for hg38).
2. Regulatory Region Set Enrichment Analysis
RegRegSEA adapts the widely used Gene Set Enrichment Analysis (GSEA) framework (Subramanian et al., 2005) to the context of epigenomic data. While standard GSEA analyzes lists of genes, RegRegSEA analyzes lists of genomic regions (e.g., candidate DMRs or ATAC-seq peaks) to detect whether a set of regulatory regions (e.g., binding sites of a specific transcription factor) shows a statistically significant tendency to occur at the top or bottom of the global ranking of observed epigenetic changes.
The Statistical Framework
The core analysis proceeds in three main steps:
1. Ranking Genomic Regions
First, all tested genomic regions in your dataset are ranked based on their differential signal. The ranking metric is calculated as:
Metric = -log10(p-value) × sign(Effect Size)
This ensures that the most significantly hyper-methylated (or accessible) regions appear at the top of the list (positive end), while the most significantly hypo-methylated (or closed) regions appear at the bottom (negative end). Non-significant regions cluster in the middle.
2. Calculating the Enrichment Score (ES)
For a given regulatory region set S (e.g., "CTCF binding sites") an Enrichment Score (ES) is calculated by walking down the ranked list of genomic regions L:
- The ES is increased when we encounter a region in L that overlaps with a region in S.
- The ES is decreased when we encounter a region that does not overlap.
The magnitude of the increment depends on the correlation of the region with the phenotype. The final ES is the maximum deviation of this running sum from zero. A large positive ES indicates the regulatory set is enriched at the top of the ranked list while a large negative ES indicates enrichment at the bottom of the list.
3. Assessing Significance
To assess the statistical significance of the ES, we perform permutation testing. Instead of permuting sample labels (which requires raw data), we use a phenotype-based permutation or gene-set permutation approach adapted for region sets. We generate a null distribution for the ES and calculate an empirical p-value and a False Discovery Rate (FDR) to correct for multiple hypothesis testing across thousands of region sets.
3. Regulatory Region Set Databases
RegRegSEA leverages several comprehensive databases of regulatory region sets. Choosing the right database depends on your biological question and the organism you are studying.
UniBind (TFBSs)
UniBind provides a comprehensive map of direct Transcription Factor Binding Sites (TFBSs). These sites are derived from thousands of ChIP-seq experiments and are additionally computationally validated to ensure they contain the specific high-affinity binding motif of the targeted TF.
When to use: Use UniBind when you want high-confidence, experimentally supported TFBSs derived from ChIP-seq data.
Collections:
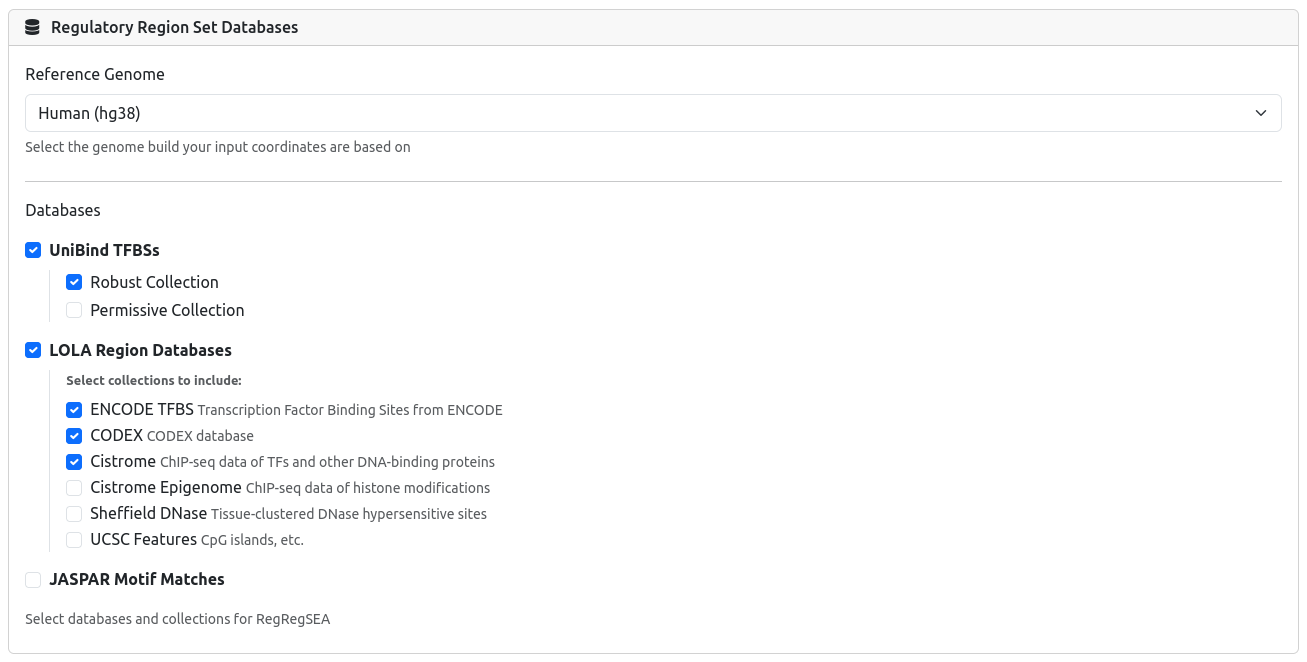
- Robust Collection (Recommended): Contains TFBSs supported by high-quality ChIP-seq peaks and stringent motif matching. Use this for the most reliable results.
- Permissive Collection: Uses more lenient thresholds for peak calling and motif matching. Use this if you are interested in a broader set of potential binding events, accepting a potentially higher false-positive rate.
LOLA Region Databases
The LOLA Region Databases aggregate region sets from various sources, offering a wider variety of genomic features beyond just TFBSs.
When to use: Use LOLA when you want to explore broader epigenomic features (like histone marks) or to complement UniBind TFBS analysis with TFBSs from other sources.
Collections (Human hg38):
- ENCODE TFBS: TFBSs from the ENCODE project.
- Cistrome Cistrome/Epigenome: Large-scale collection of ChIP-seq data for TFs and histone modifications.
- Sheffield DNase: Tissue-specific DNase hypersensitive sites.
- CODEX: Curated ChIP-seq data.
- UCSC Features: Genomic annotations like CpG islands, introns, and repeats.
Collections (Mouse mm10):
- ENCODE TFBS: Mouse TFBSs from ENCODE.
- CODEX: Curated mouse ChIP-seq data.
- UCSC Features: Mouse genomic annotations.
JASPAR (Motif Scans)
JASPAR is an open-access database of curated, non-redundant transcription factor binding profiles (motifs).
When to use: Use JASPAR for an exploratory analysis. Unlike UniBind/LOLA (which rely on existing ChIP-seq data), JASPAR represents theoretical binding sites based on motif scanning across the entire genome. This provides much broader coverage (including TFs with no ChIP-seq data) but does not guarantee that the site is actually bound in vivo.
Please note that while RegRegSEA usually only takes a few minutes for UniBind and LOLA Region DBs, running RegRegSEA with JASPAR motif matches substantially increases the runtime of the analysis due to the broad coverage.
4. Input Data Format
RegRegSEA accepts differential analysis results from tools like dmrseq, DESeq2, or limma. The input file must be a delimited text file (CSV, TSV, BED) or Excel file containing (at least) the following columns:
| Column Name | Description | Example |
|---|---|---|
| Chromosome | Chromosome name | chr1 |
| Start | Start coordinate of the region | 10500 |
| End | End coordinate of the region | 10600 |
| Effect Size / Beta | Log fold change or methylation difference | -0.45 |
| P-value | Raw p-value of the differential test | 0.0012 |
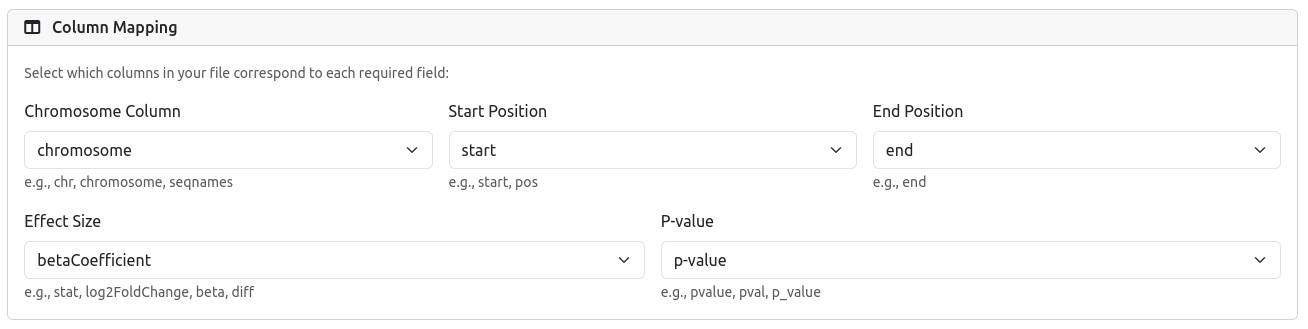
However, exact column names are not required since columns can be dynamically mapped on the New Submission page.
RegRegSEA requires region-level data. Analysis of single CpG-sites is not supported since using the full ranked list of all CpG-sites in the genome is computationally too demanding.
5. Tutorial
Running an analysis on RegRegSEA is designed to be simple and requires just a few minutes. Follow these steps to submit your job.
1) Upload Input Data
Navigate to the New Submission page and upload your differential analysis results file (CSV, TSV, TXT, BED, or Excel).
2) Map Columns
Once your file is uploaded, RegRegSEA parses the header and attempts to automatically detect the relevant columns (Chromosome, Start, End, Effect Size, P-value).
Please review the selection carefully. If the automatic detection is incorrect, use the dropdown menus to manually select the correct column from your file.
3) Select Databases
Choose the reference genome (hg38 or mm10) and select the regulatory databases and collections you wish to test against. You can select multiple databases (e.g., UniBind + LOLA) to be analyzed in a single job.
4) Parameters
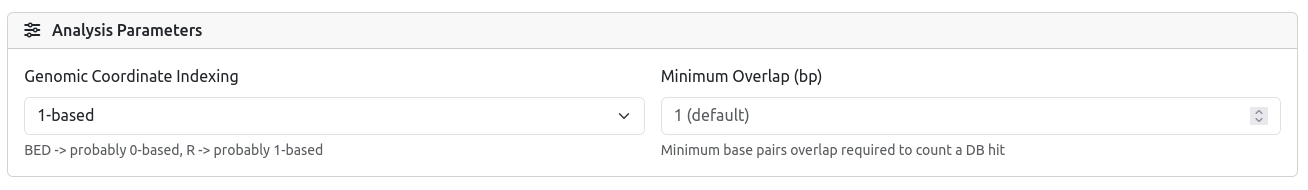
Configure the parameters for your run.
-
Coordinate System:
- Select 0-based (BED standard) if your data comes from BED files (start is 0-indexed, end is exclusive).
- Select 1-based (R/GFF standard) if your data comes from R (GenomicRanges) (start is 1-indexed, end is inclusive).
- Minimum Overlap (bp): Defines how many base pairs of overlap are required to count a region as a "hit". The default is 1 bp, which is sufficient for most analyses. Increase this value if you require stricter spatial concordance.
5) Submit Analysis Job
Click Start Enrichment Analysis. You will be redirected to the Results page and an unique Job ID will be generated. Save this ID or bookmark the page to retrieve your results later if you close the browser.
6. Interpreting Results
Once your analysis is complete, RegRegSEA presents a table of enriched regulatory sets ranked by their significance.
Understanding the Metrics
- Normalized Enrichment Score (NES): The primary statistic for comparing results. A positive NES means the regulatory set is enriched at the top of your ranked list (e.g., associated with hyper-methylation or open chromatin), while a negative NES means enrichment at the bottom.
- FDR (q-value): The estimated False Discovery Rate. We recommend an FDR < 0.05 as a standard cutoff for significance.
Visualizing Top Enriched Sets
RegRegSEA provides an interactive interface to generate a bar plot of the most highly enriched region sets. You can customize the visualization using the following controls:
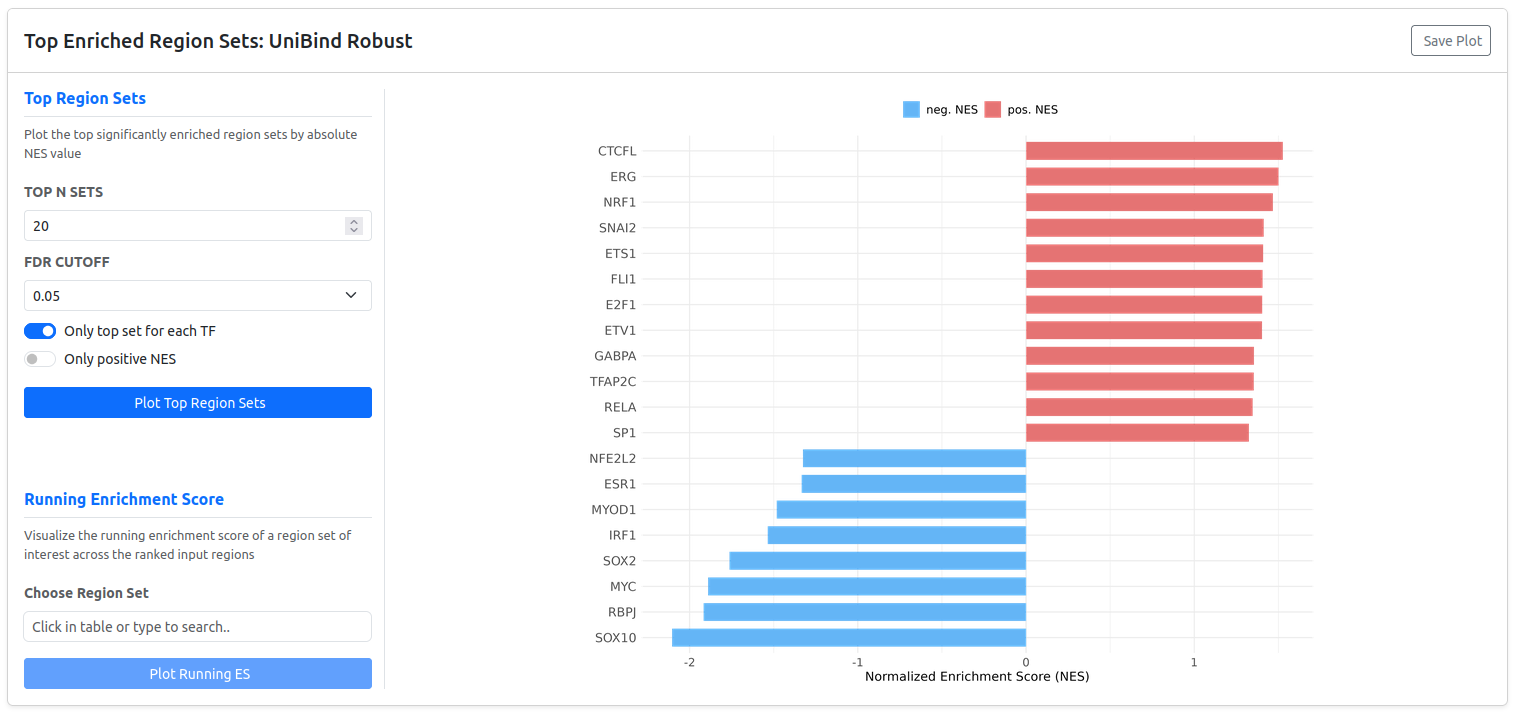
- Top N Sets: Choose how many top region sets to display (default: 20).
- FDR Cutoff: Filter out results that do not meet the specified significance threshold.
- Only top set for each TF: If enabled, the plot shows only the single most enriched region set for each Transcription Factor, reducing redundancy.
- Only Positive NES: Useful if your biological question focuses only on one direction (e.g., identifying factors associated with chromatin opening).
Running Enrichment Scores & Leading Edge Regions
Select a region set from the enrichment results table and click the "Plot Running ES" button to generate a Running Enrichment Score plot. This visualizes the running sum of the enrichment score across your ranked list of input regions for a region set of interest.
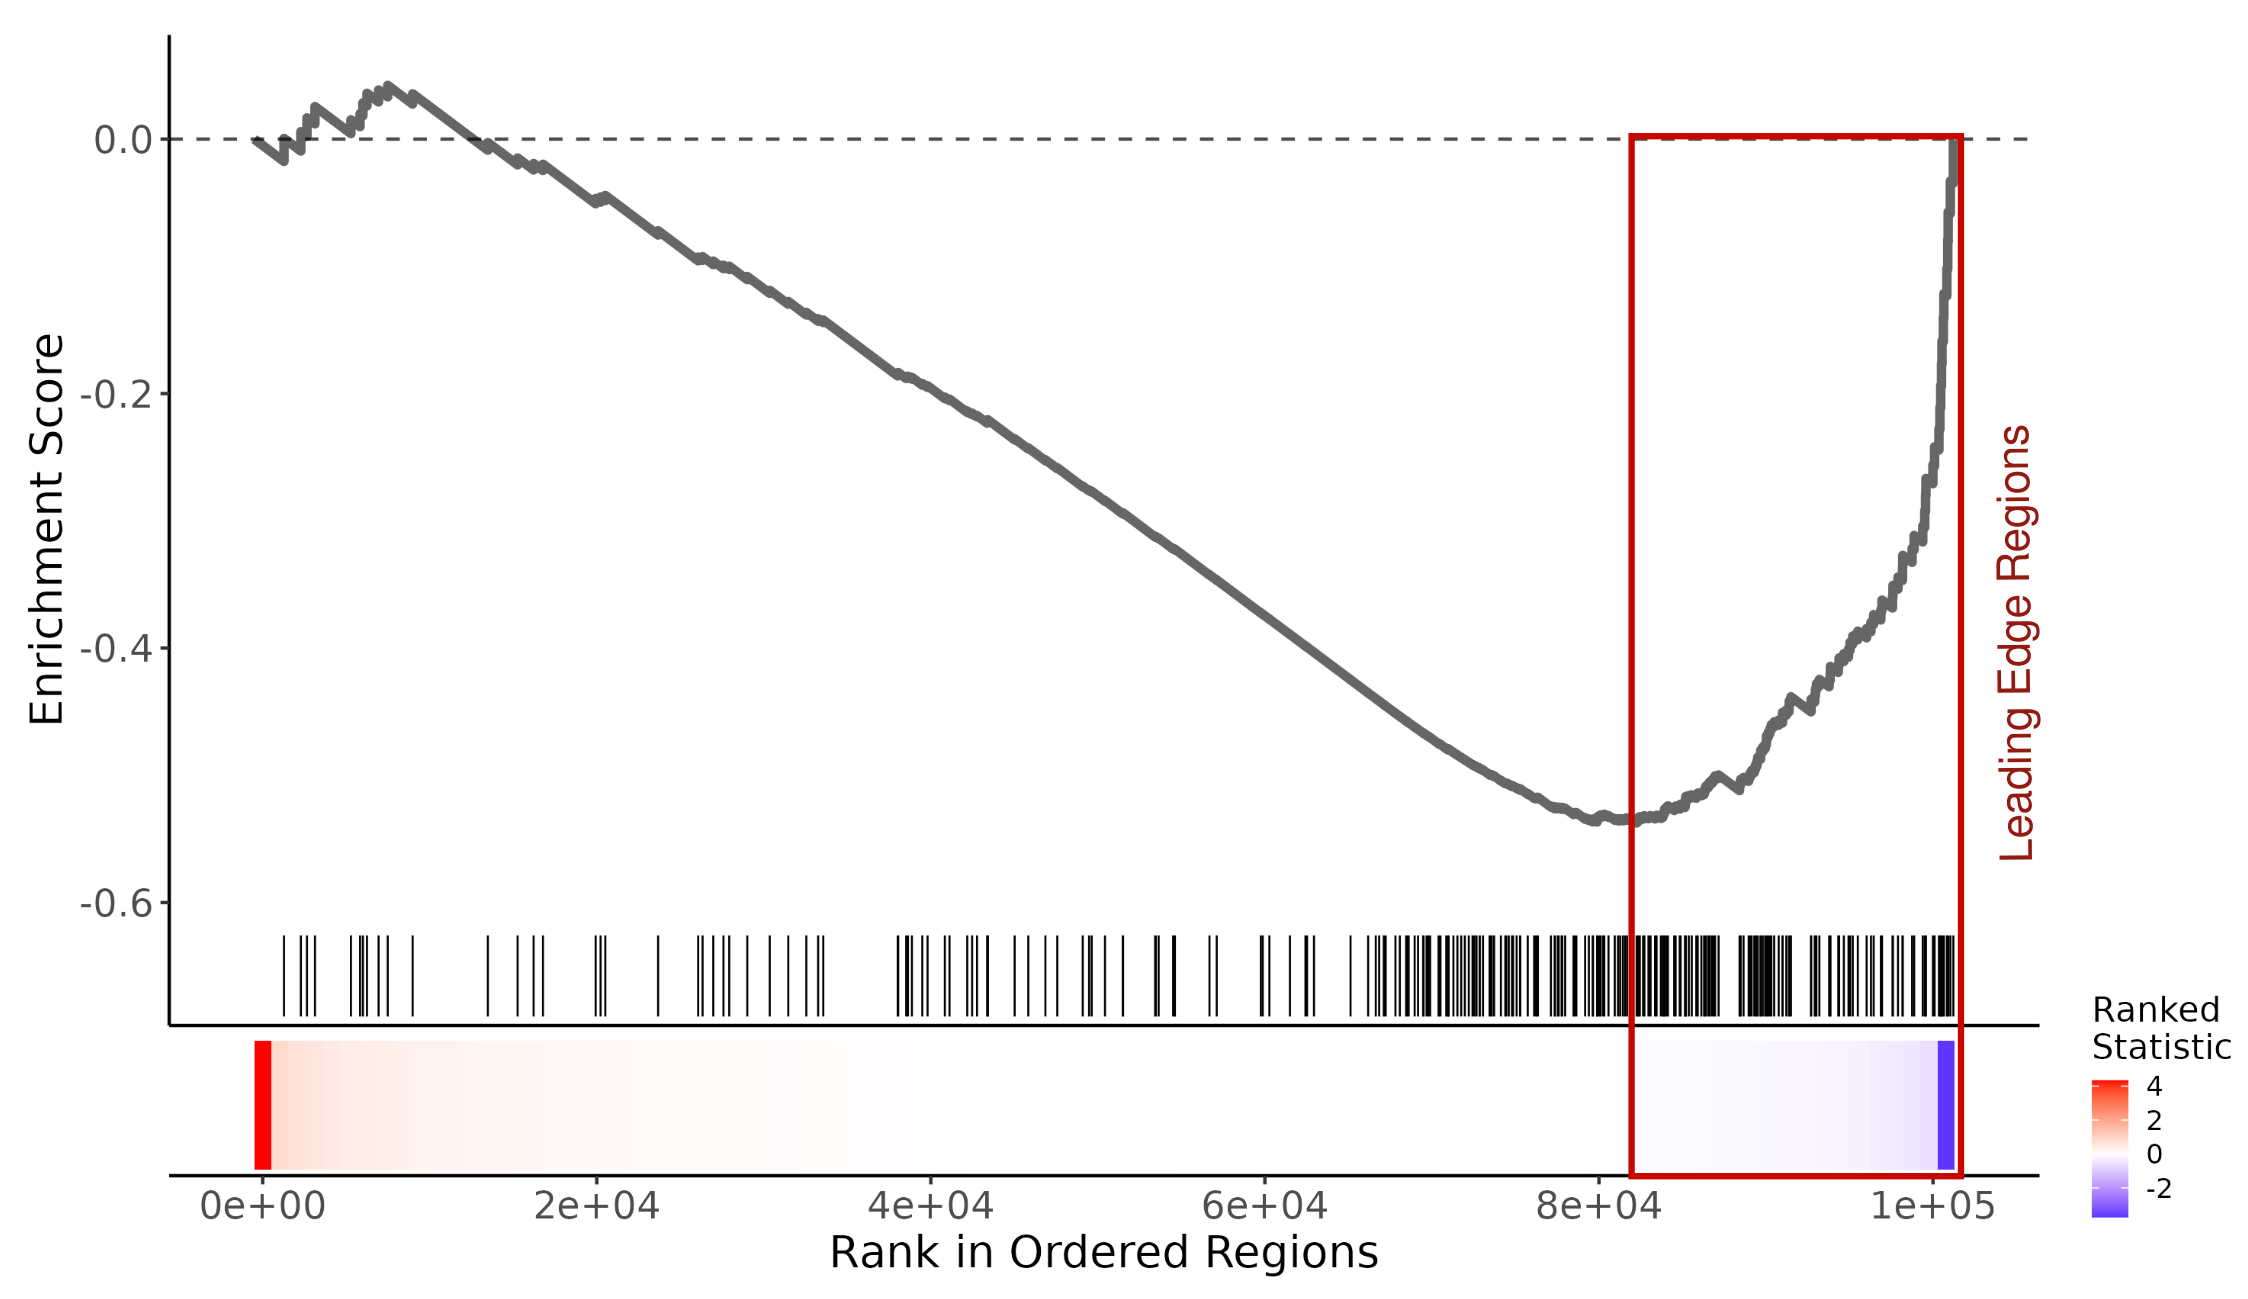
The Leading Edge Regions (highlighted in red) are the subset of genomic regions that contribute most to the enrichment signal (the "hits" appearing before the Enrichment Score reaches its peak). These represent the specific loci where the regulatory factor is likely active and associated with your phenotype.
The leading edge regions can be downloaded in BED format for downstream analyses, such as integration with gene expression data, motif discovery, or visualization in a genome browser.
7. Citation
If you use RegRegSEA in your research, please cite:
RegRegSEA: A Webserver for Regulatory Region Set Enrichment Analysis of Epigenomic Data
as well as the respective region set databases used in your analysis.